RK metabolites QuEChERS-EMR stepwise recovery
7/29/2020
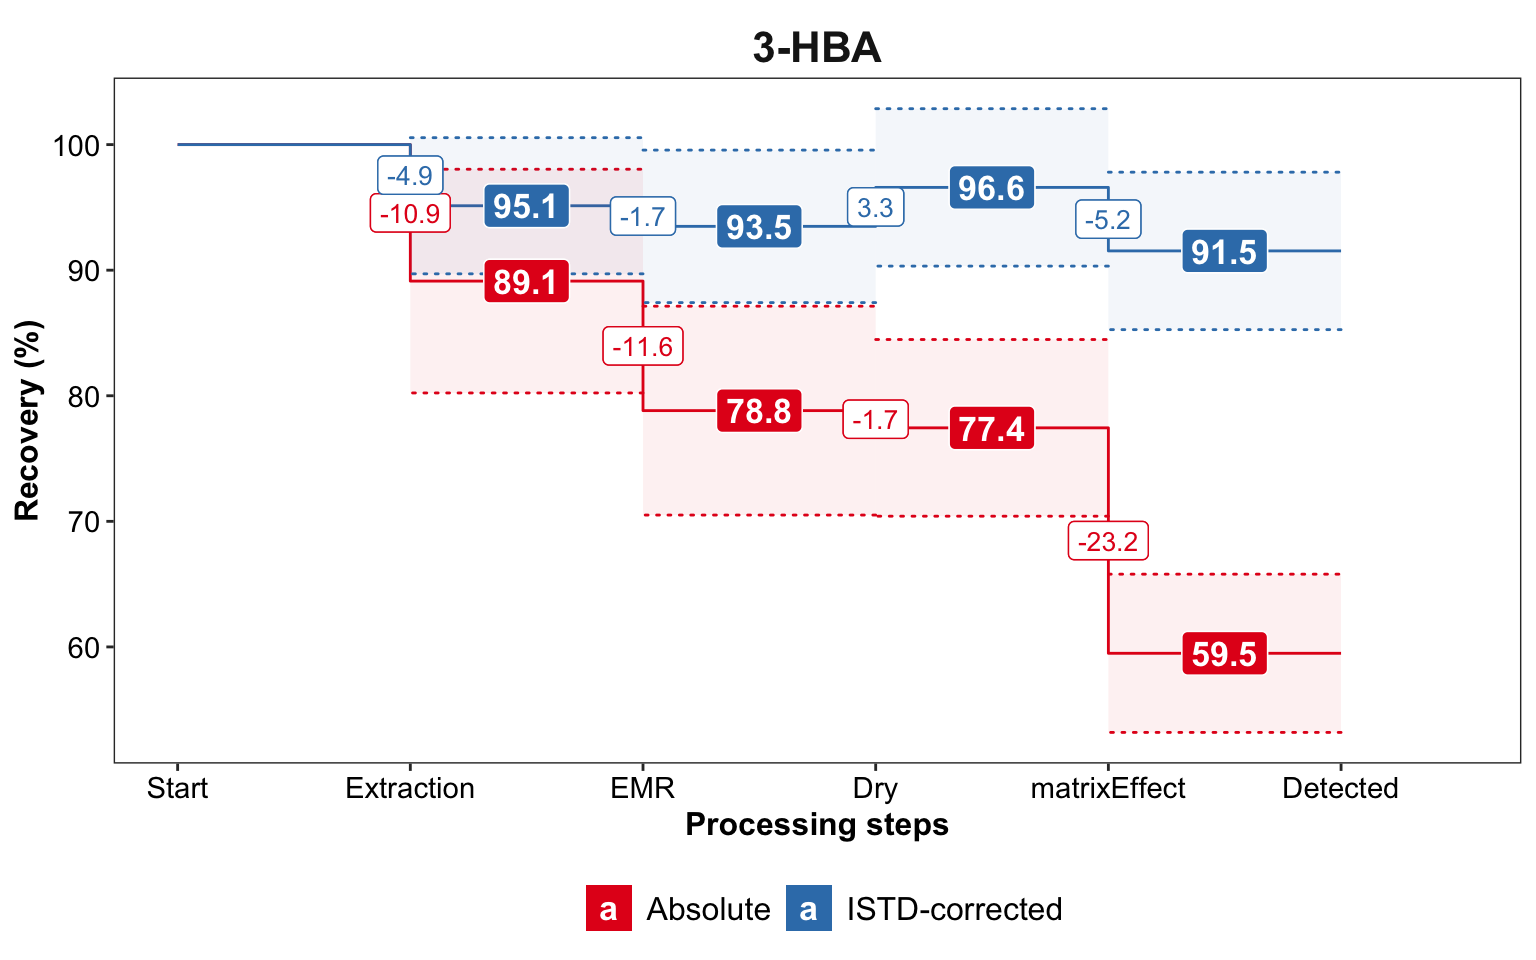
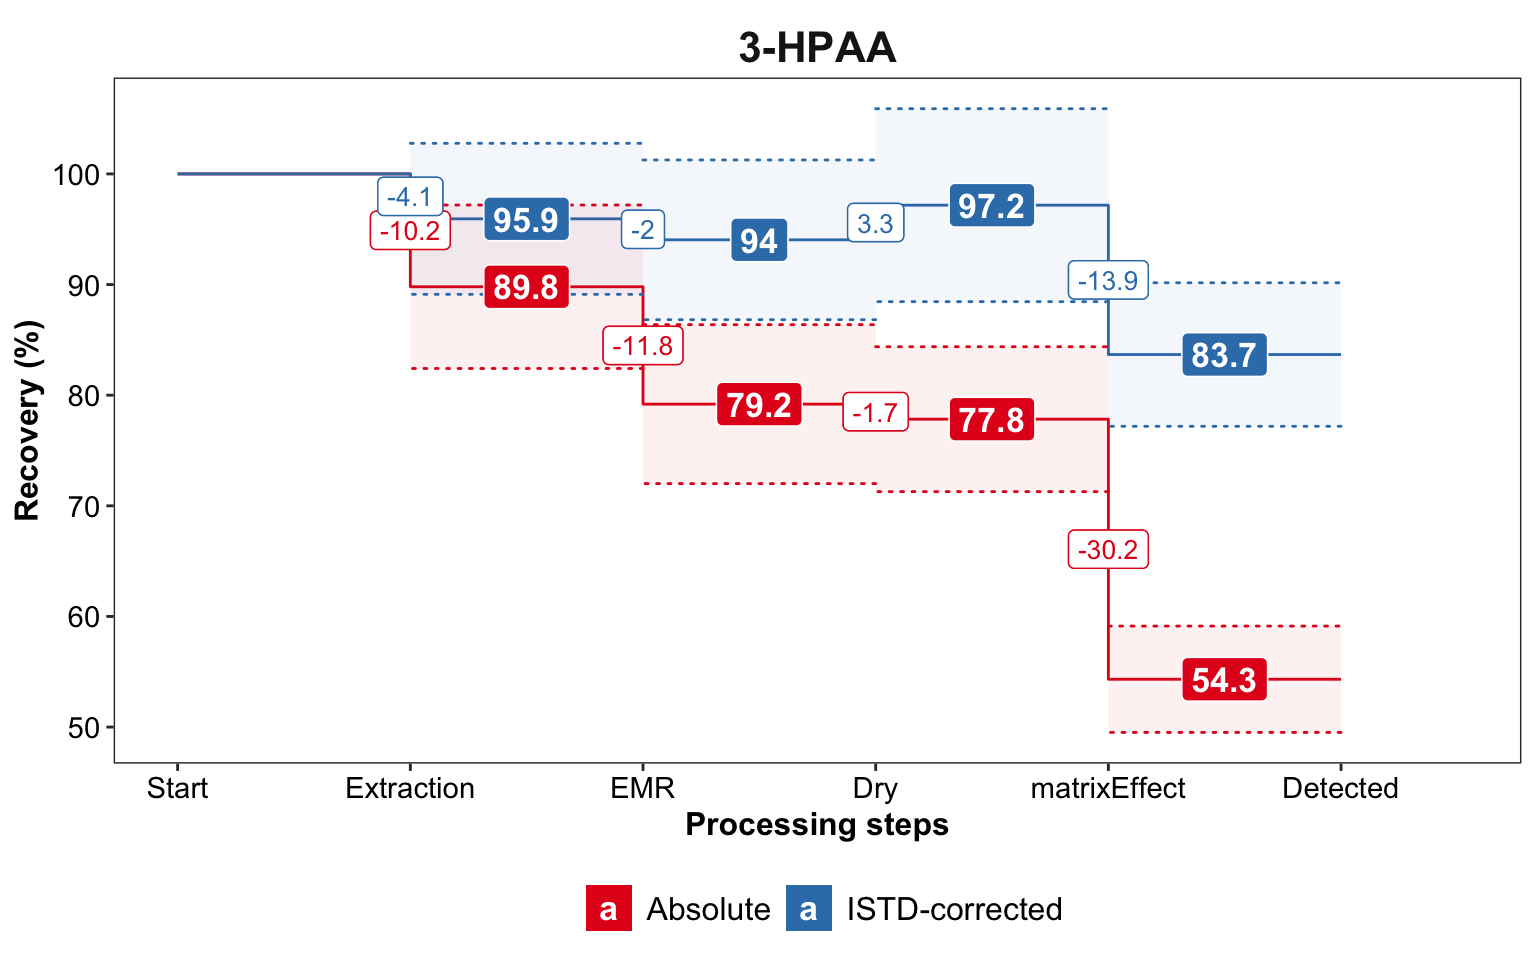
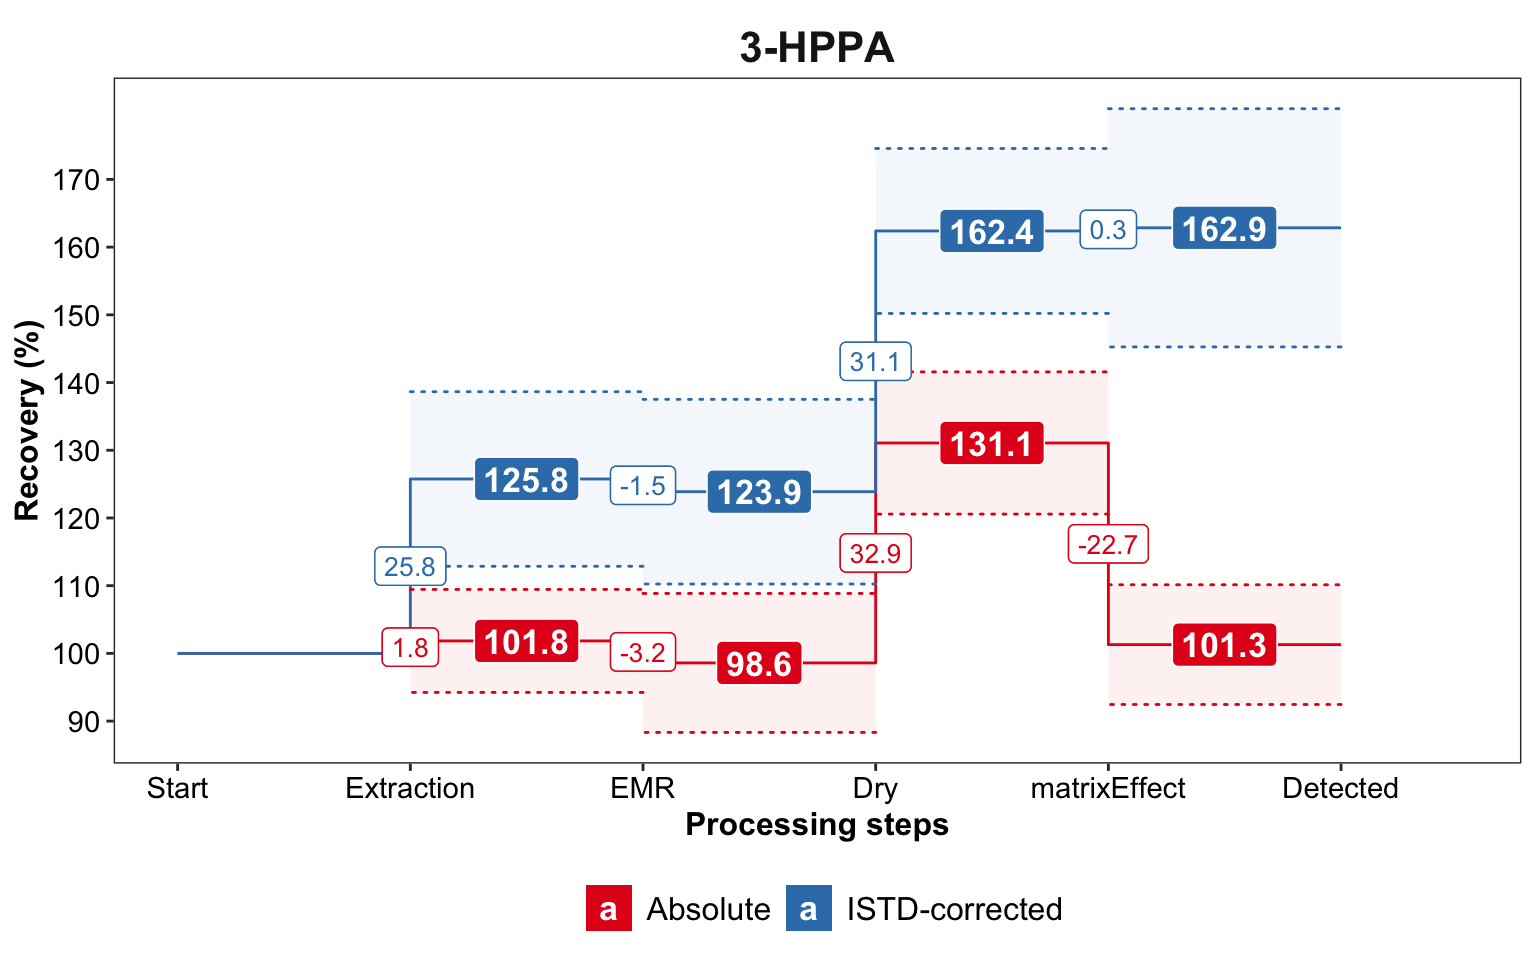
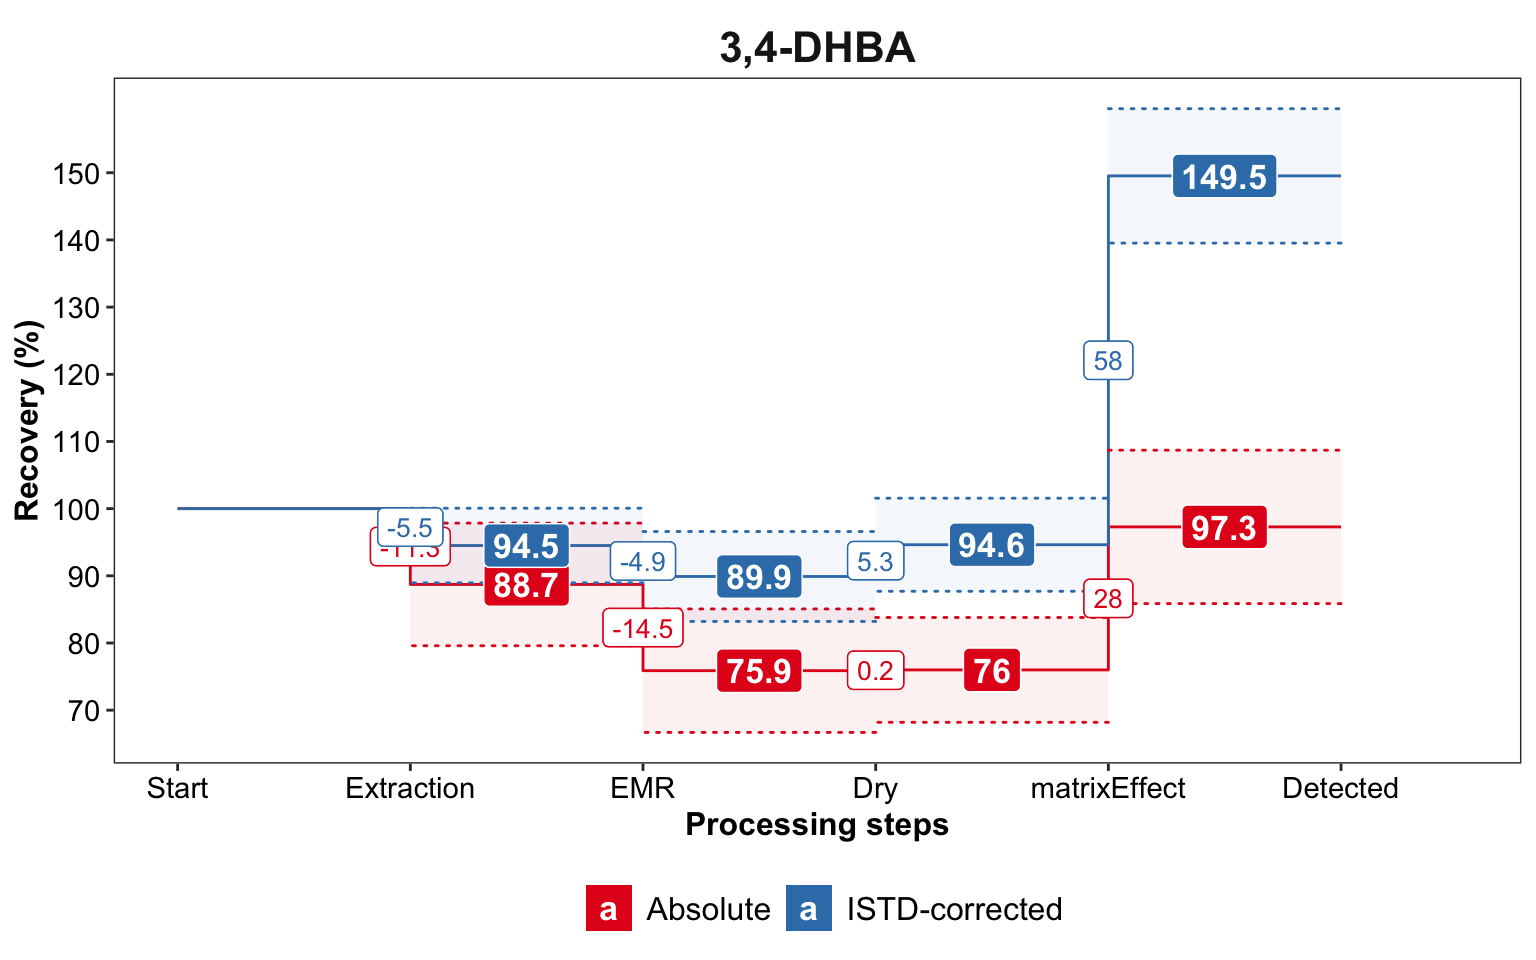
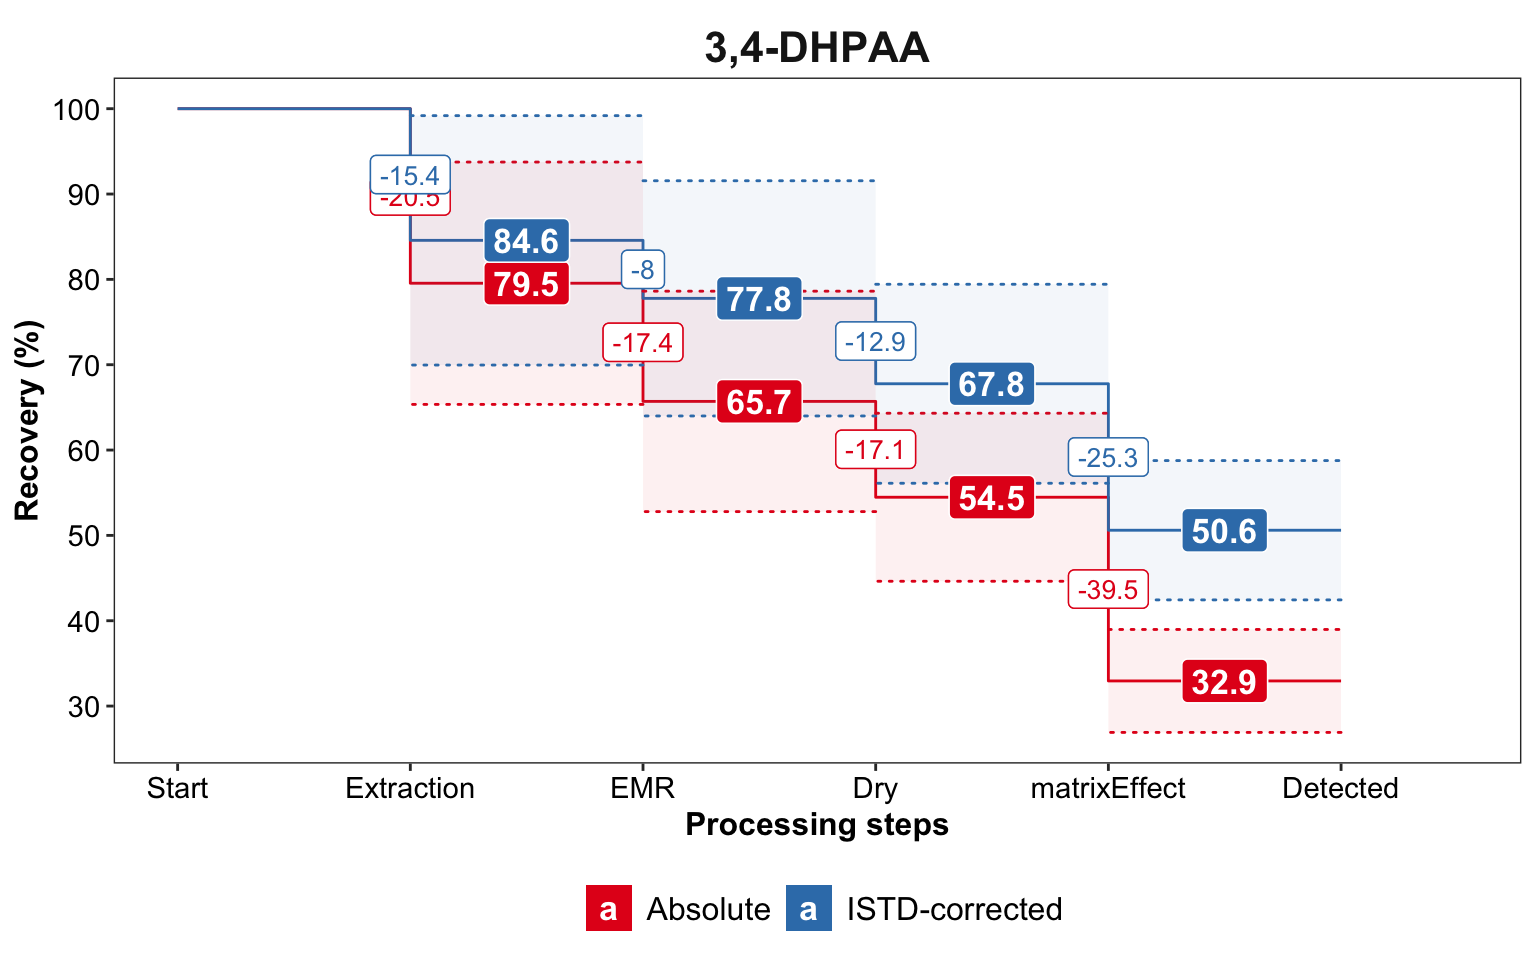
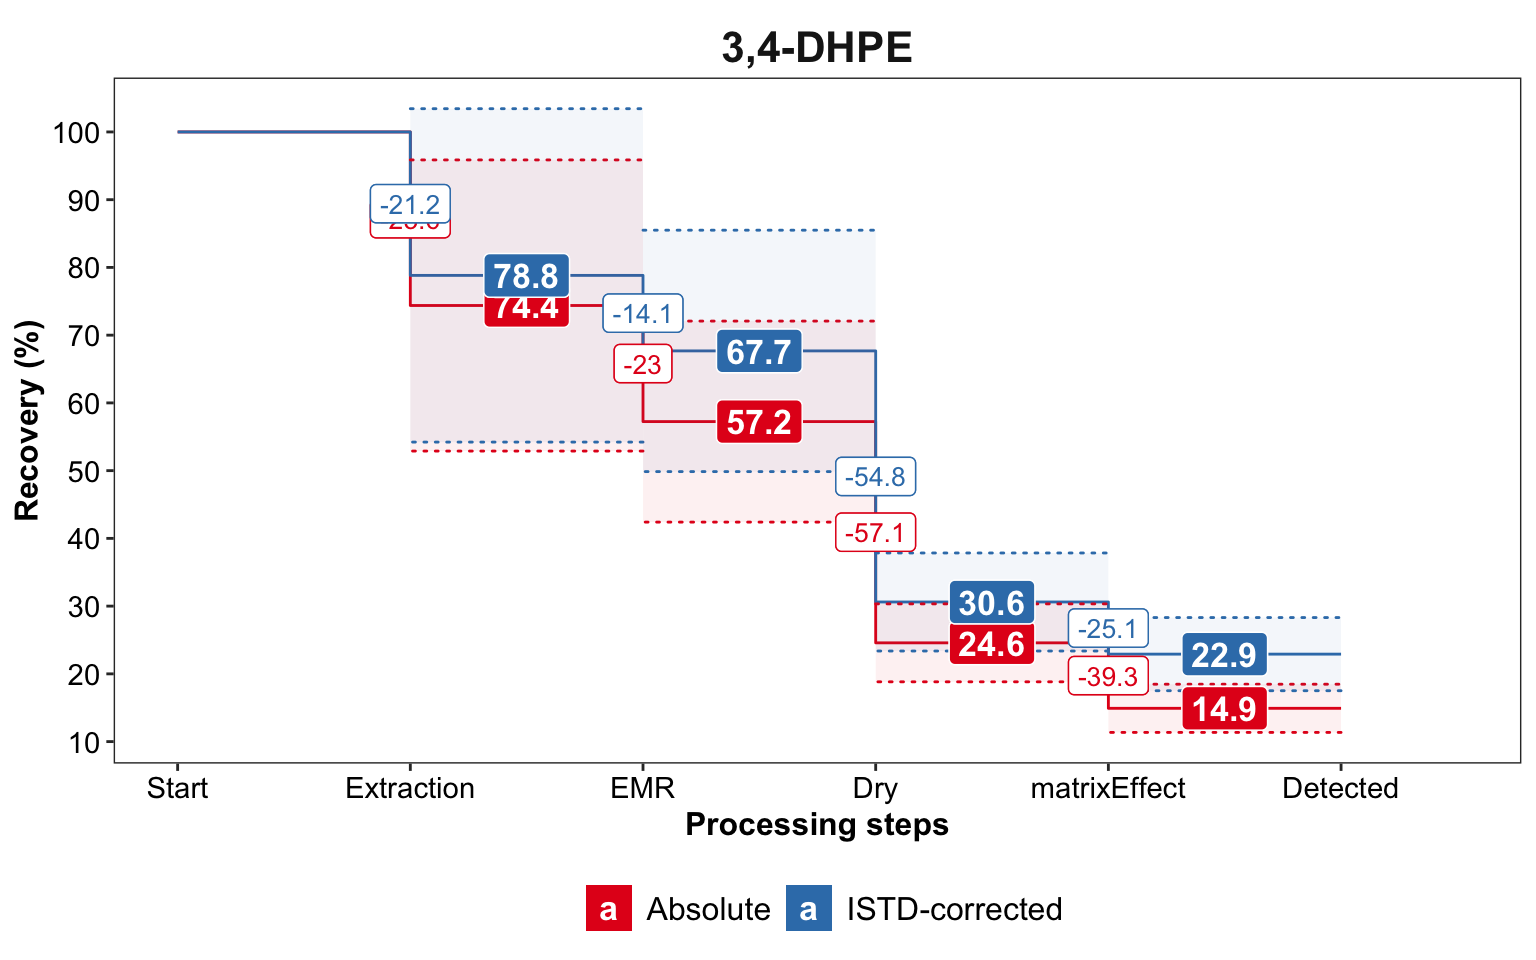
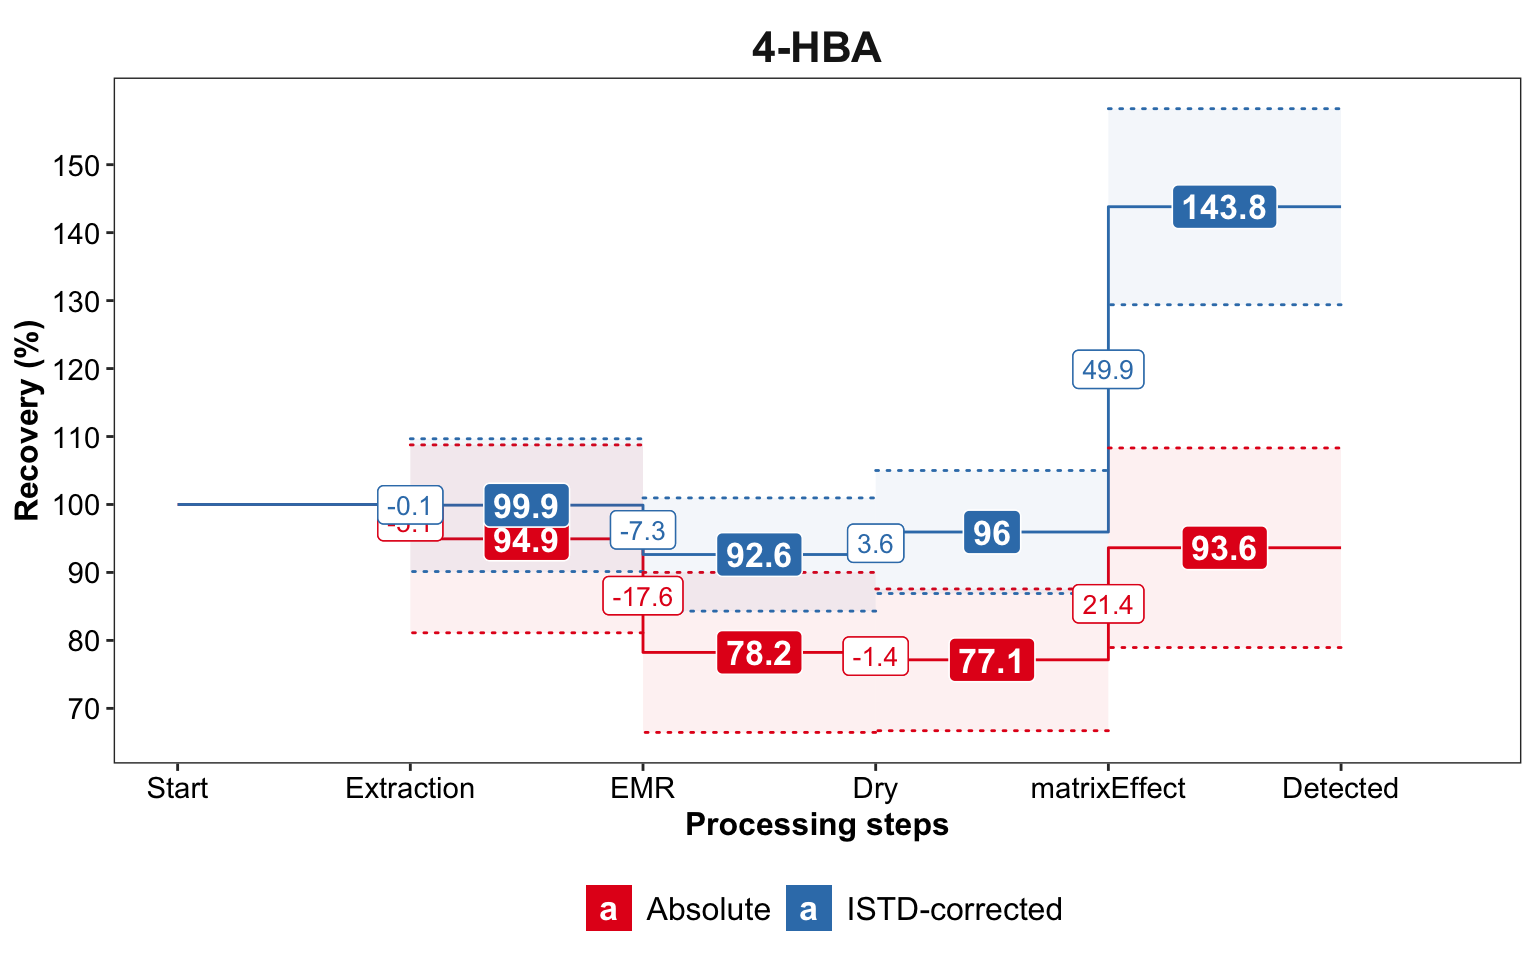
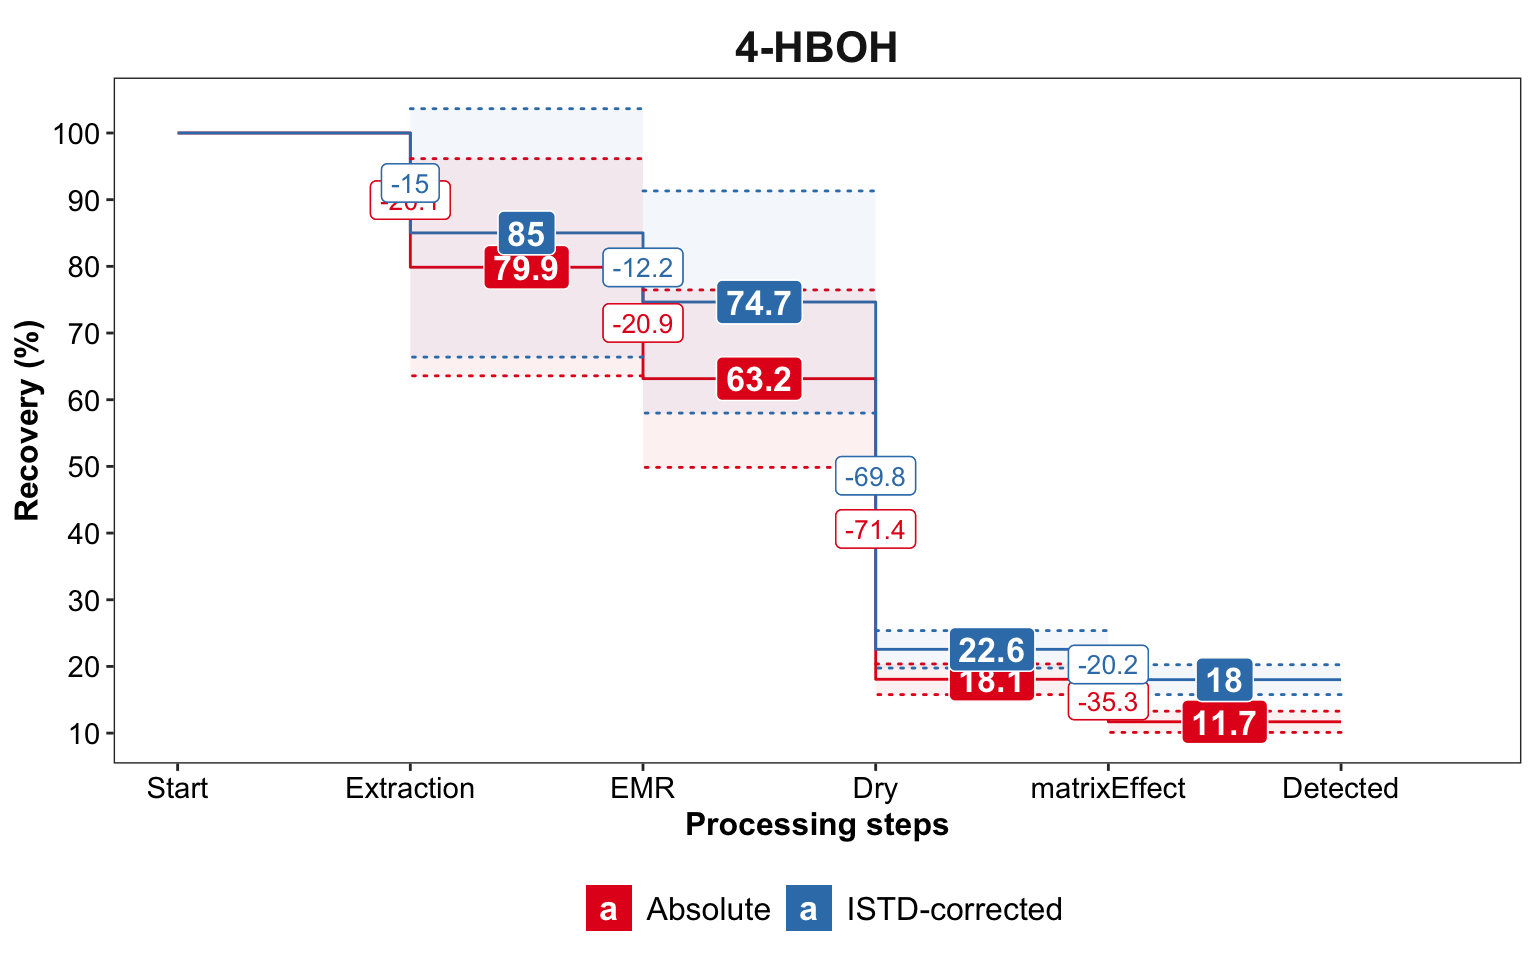
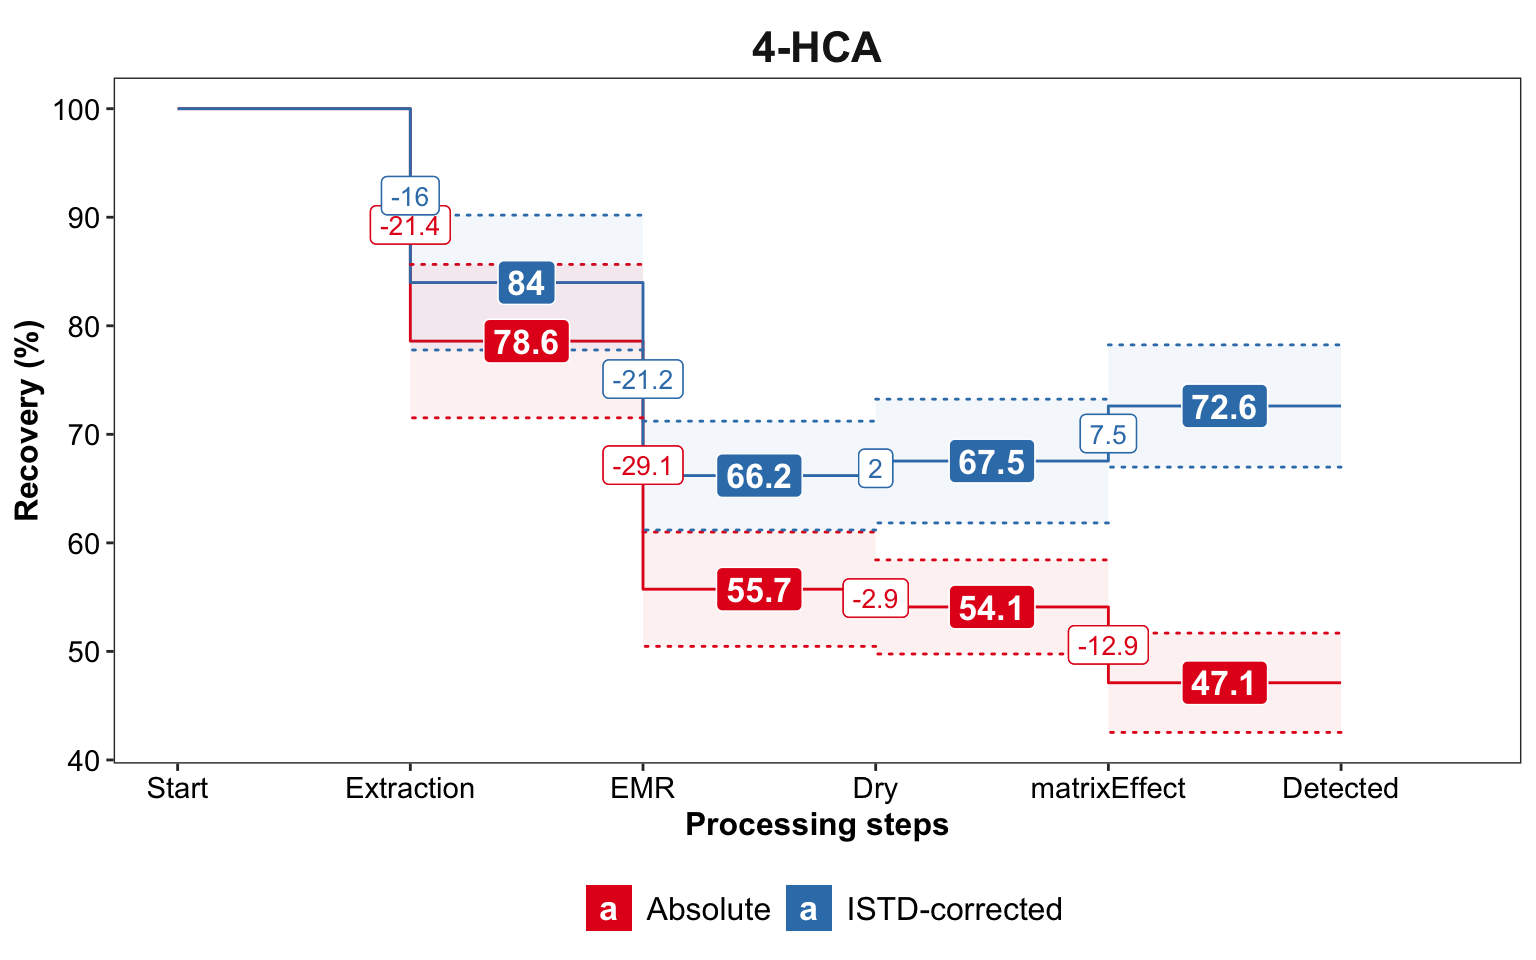
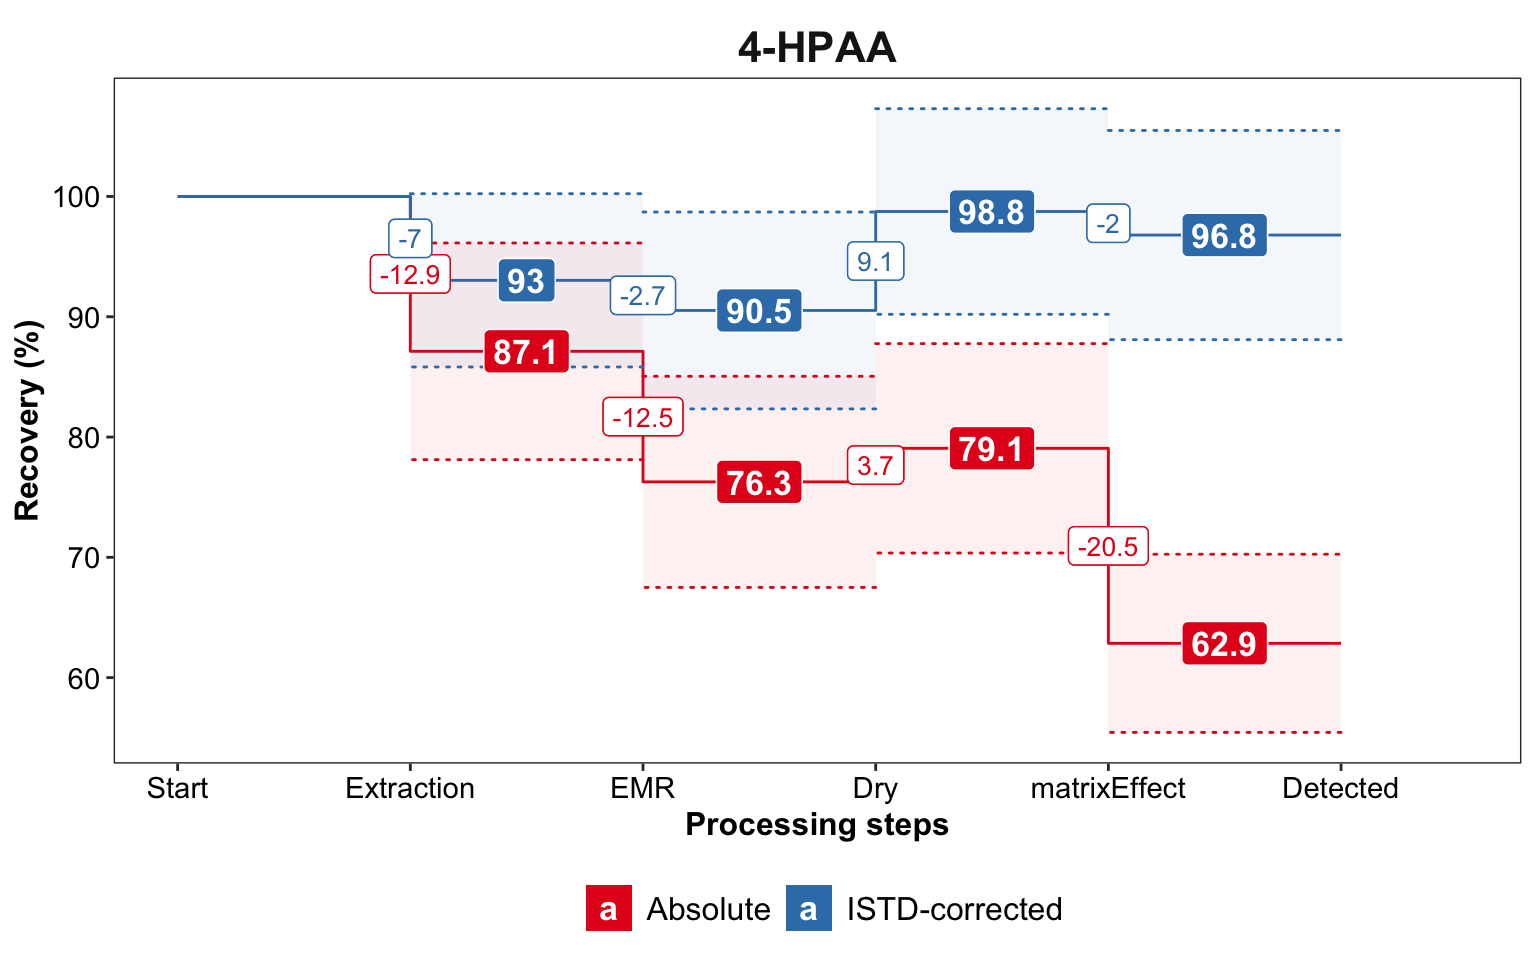
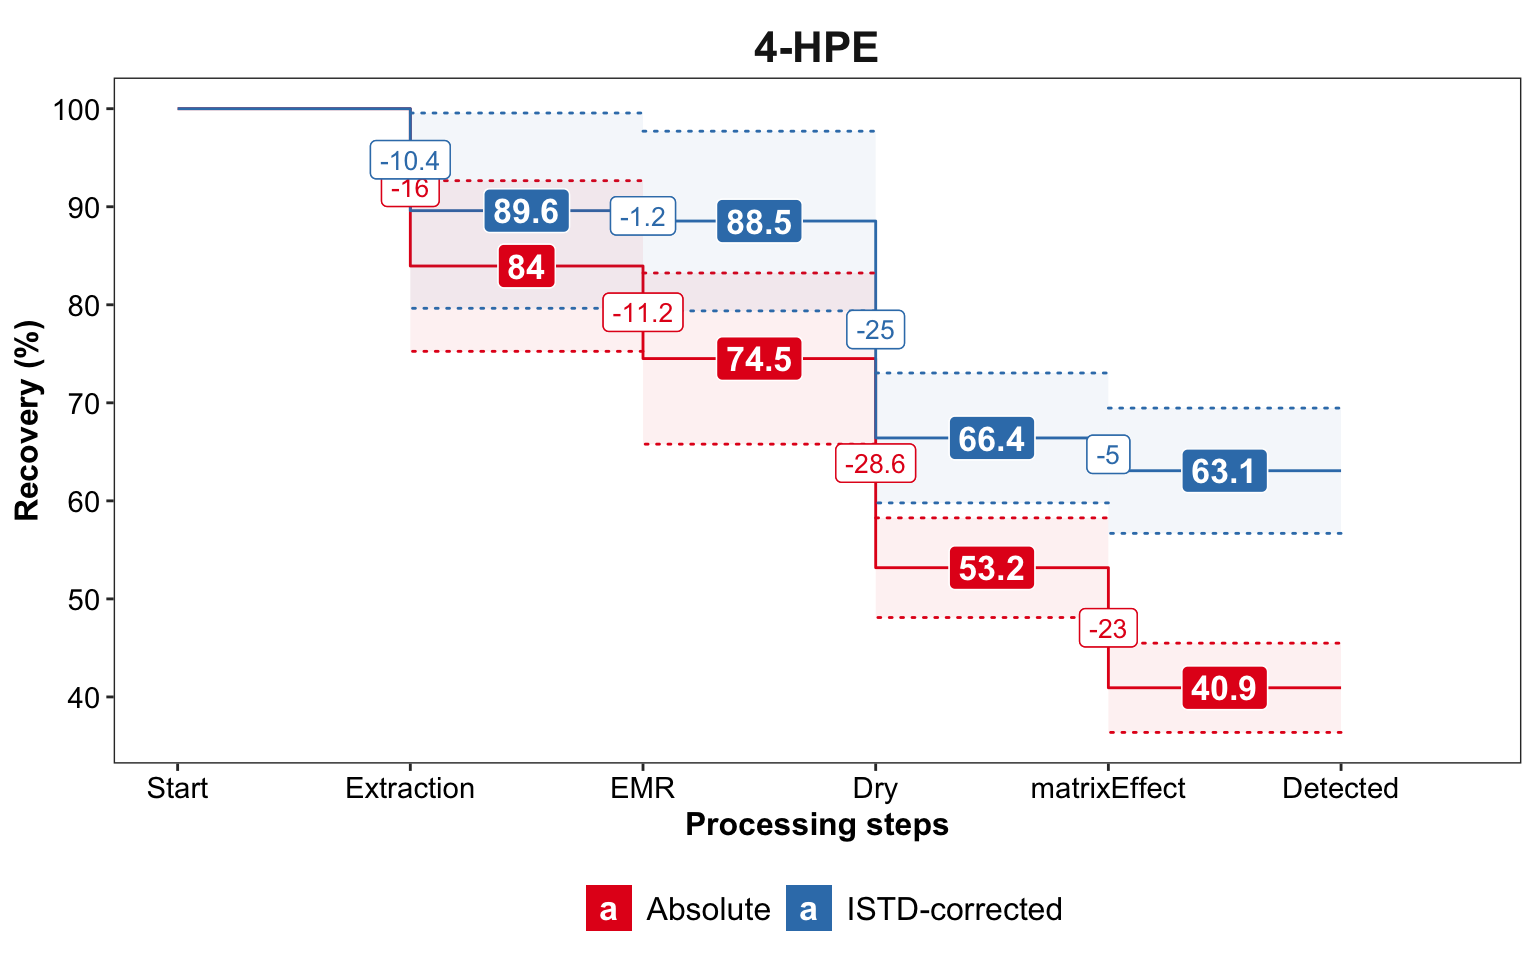
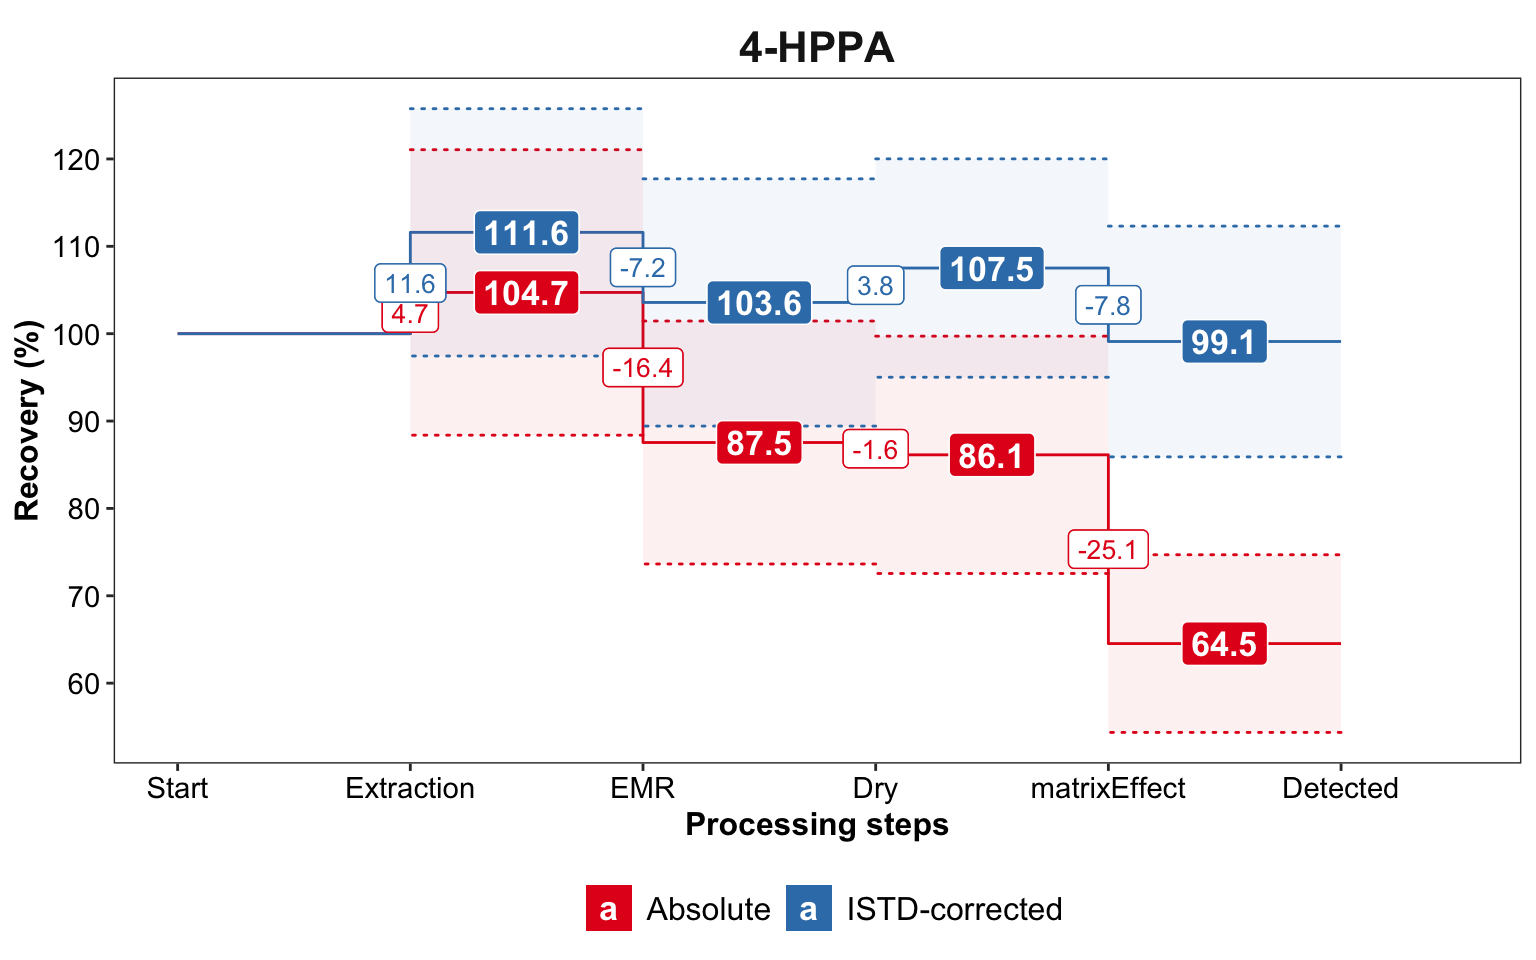
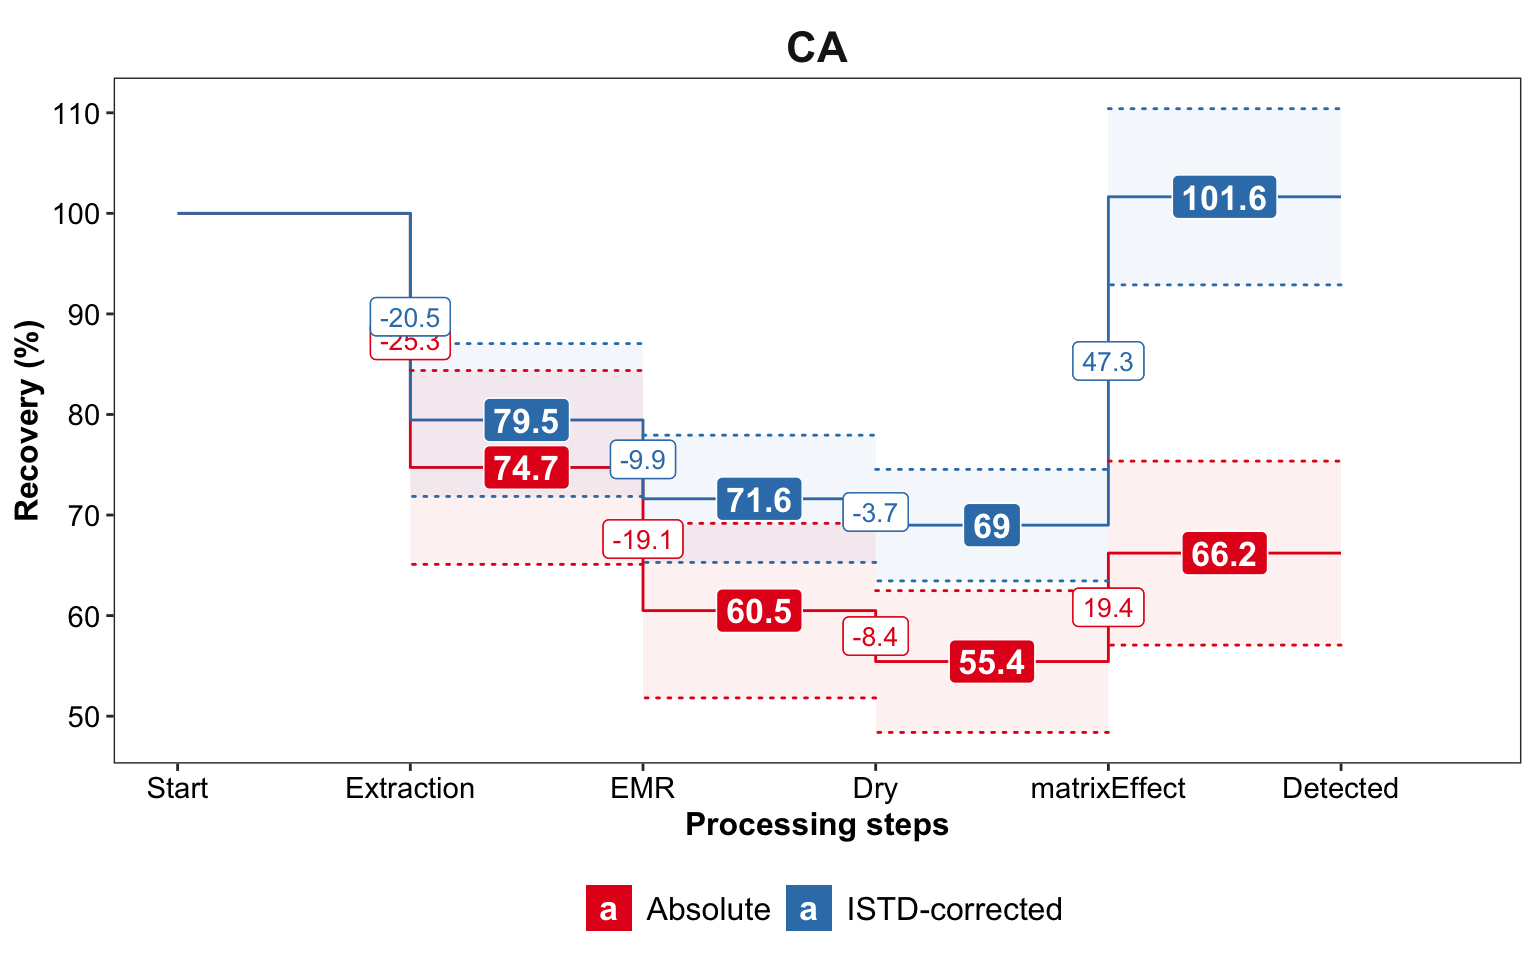
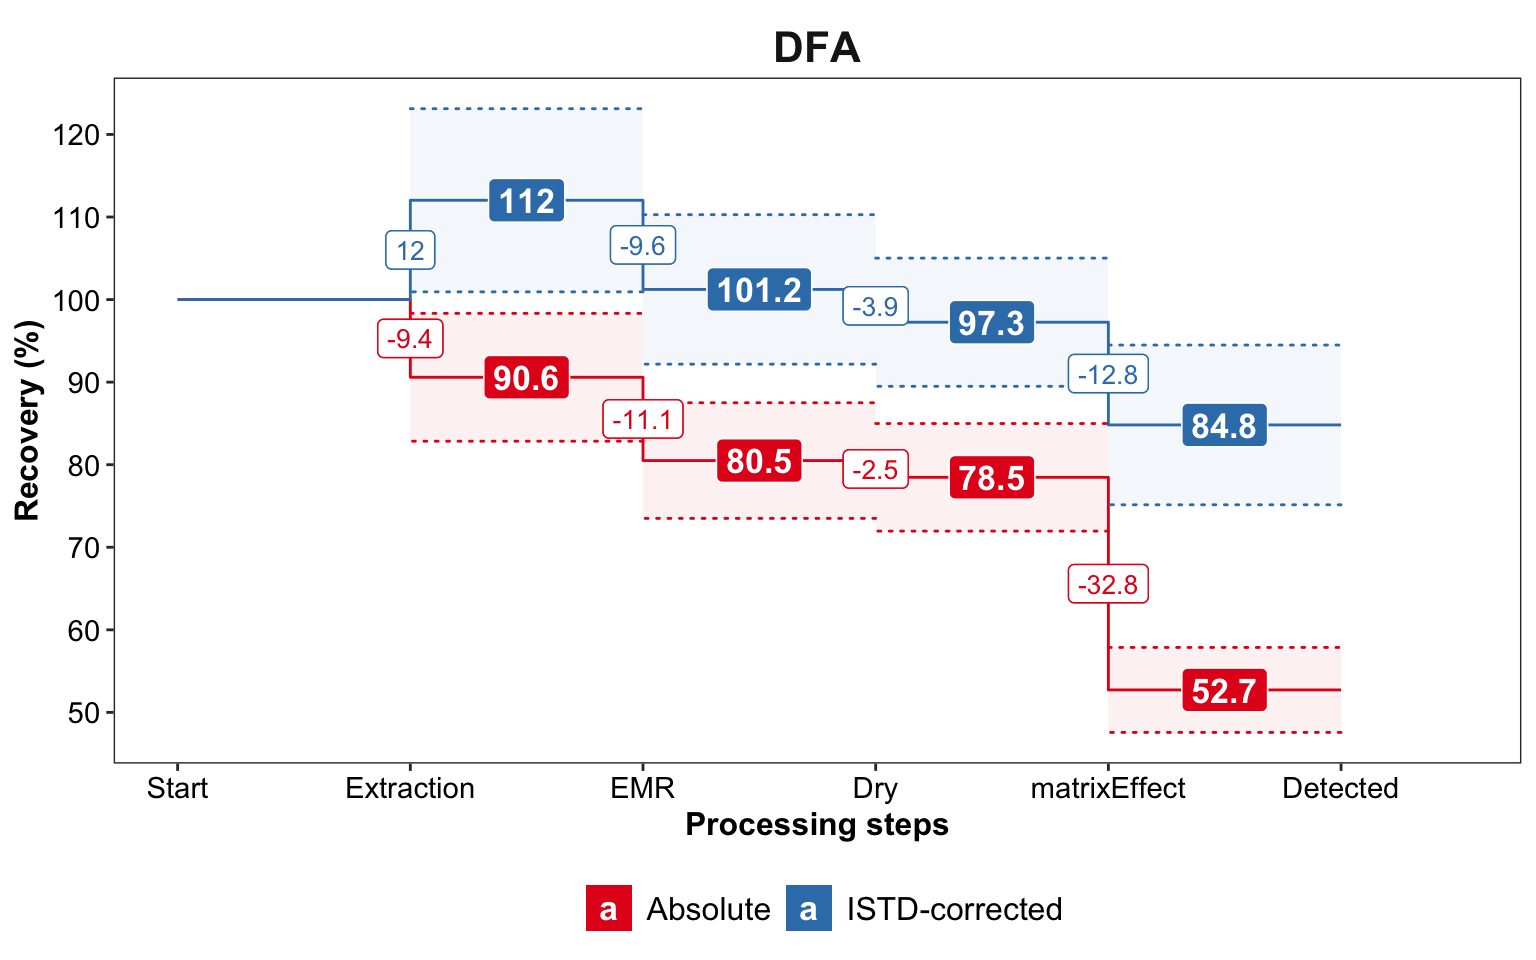
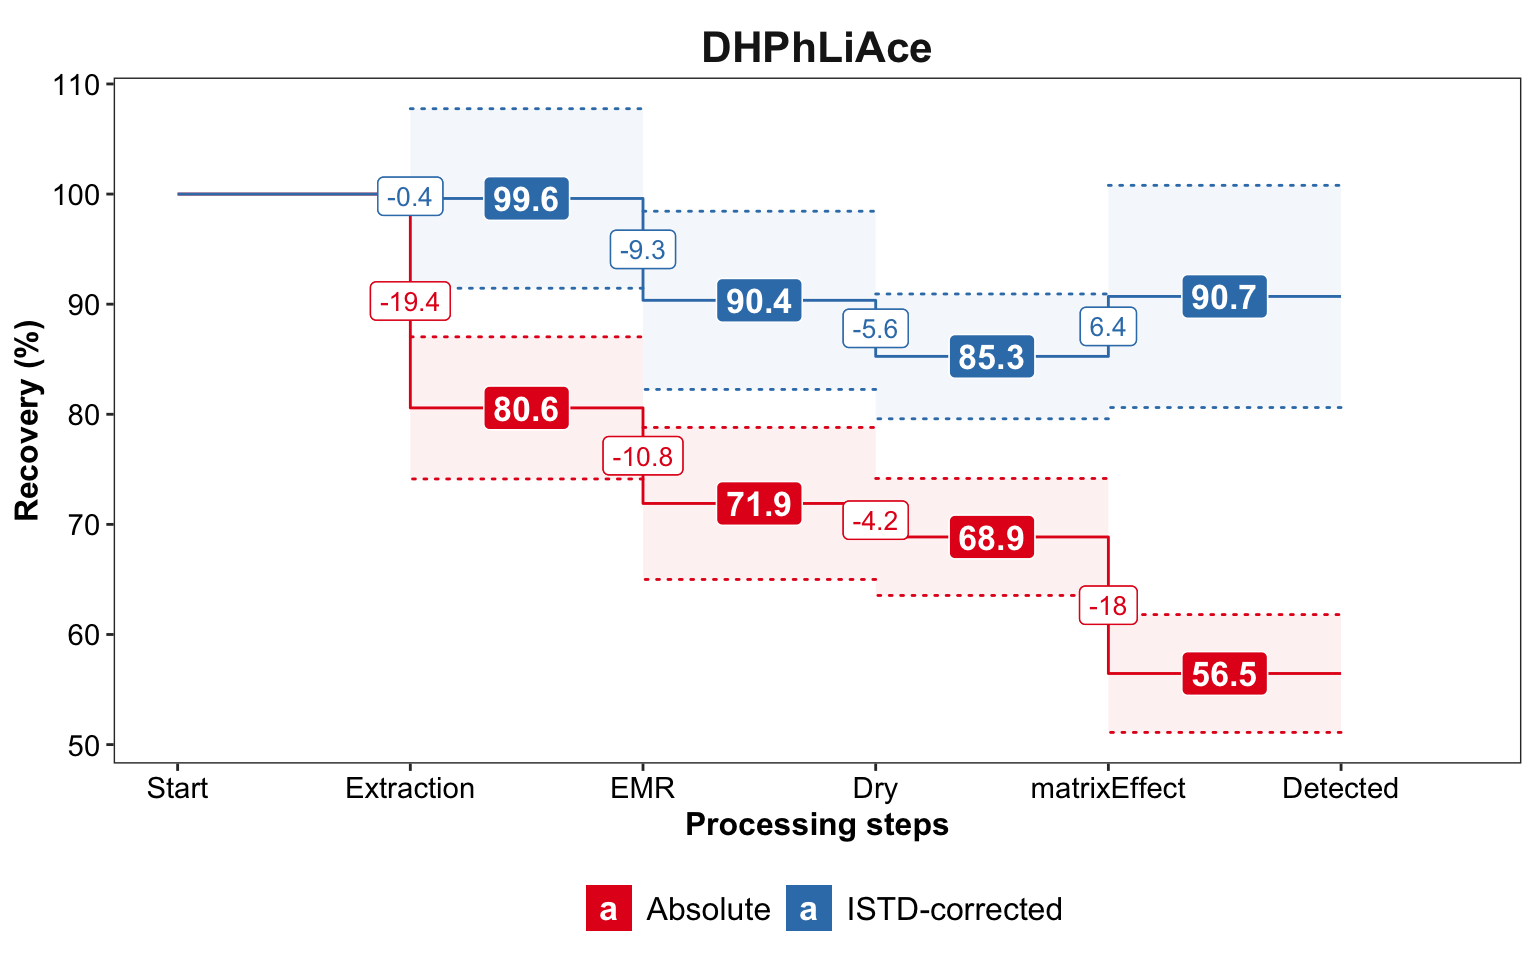
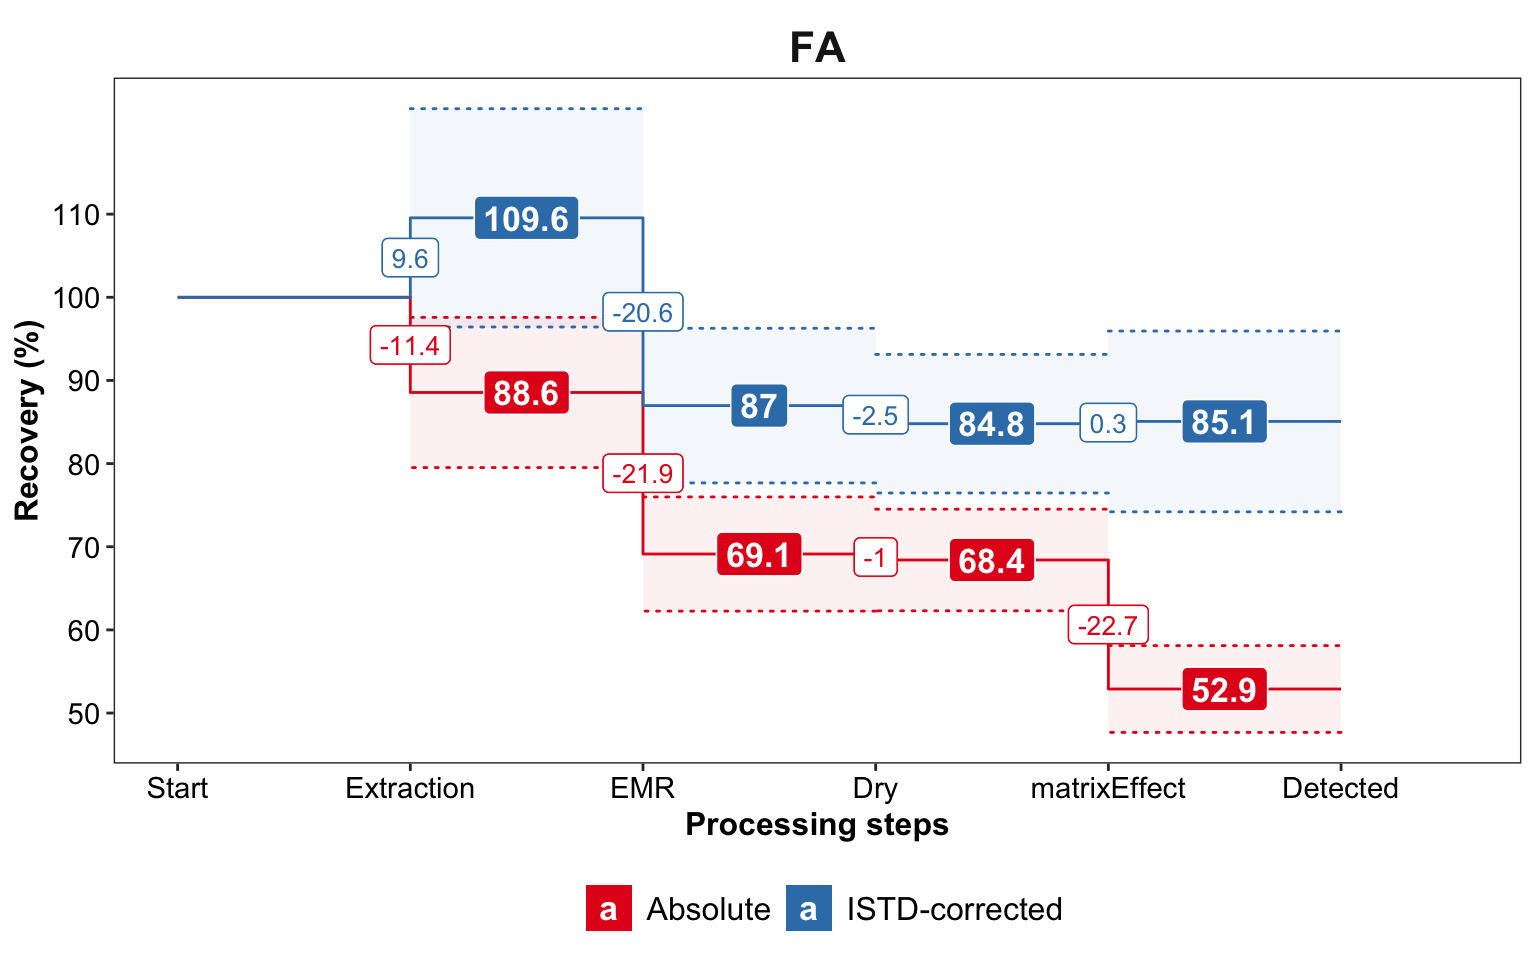
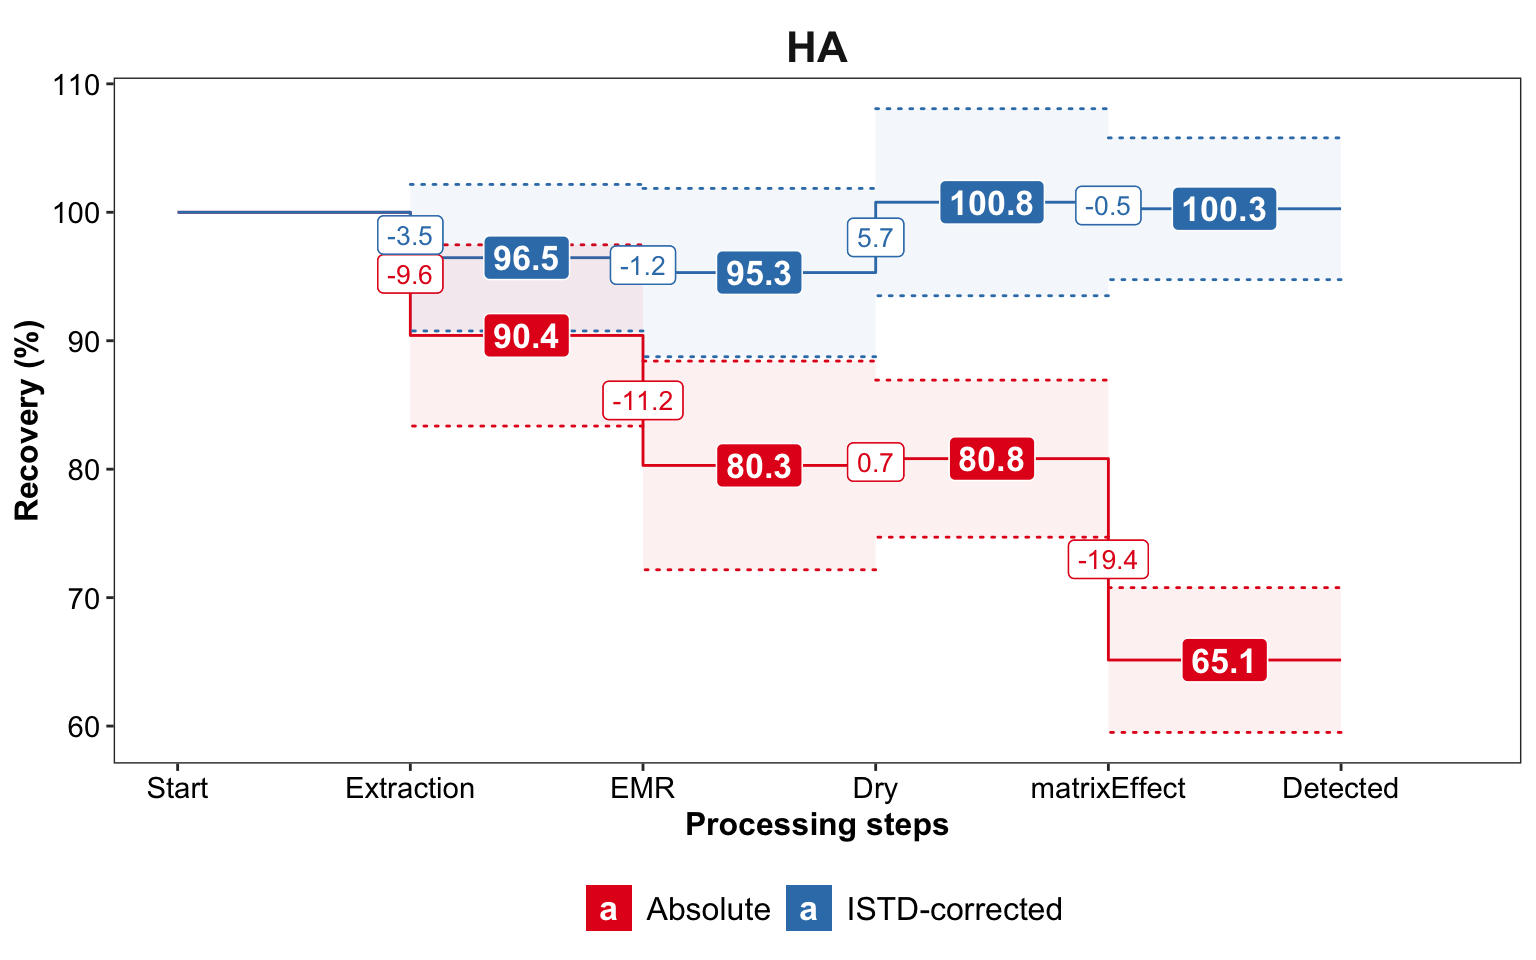
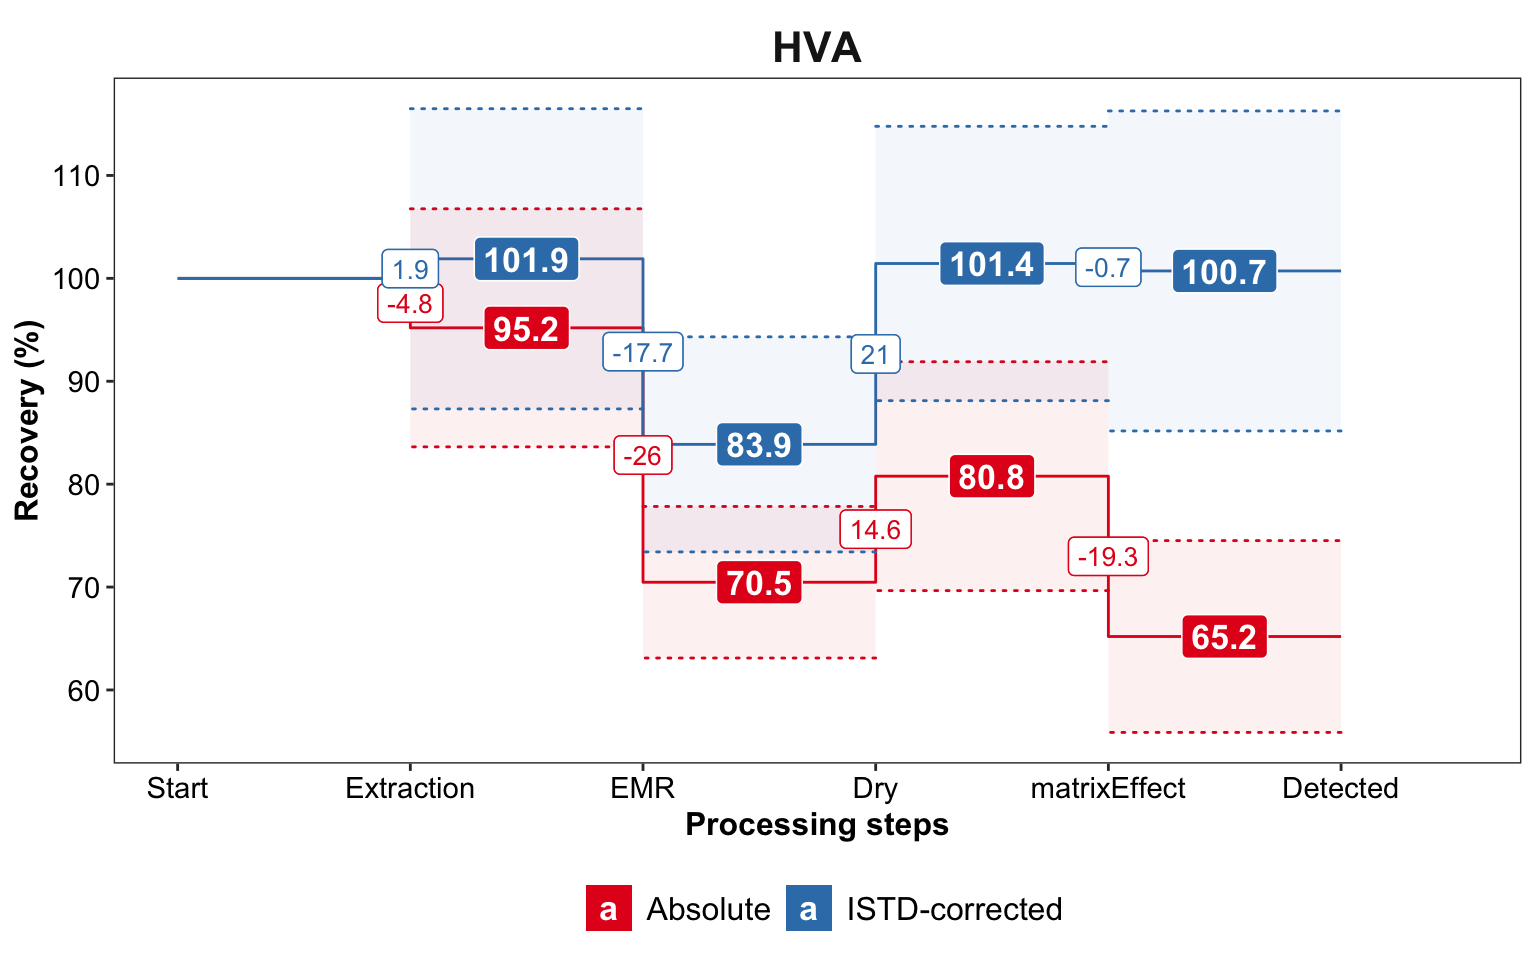
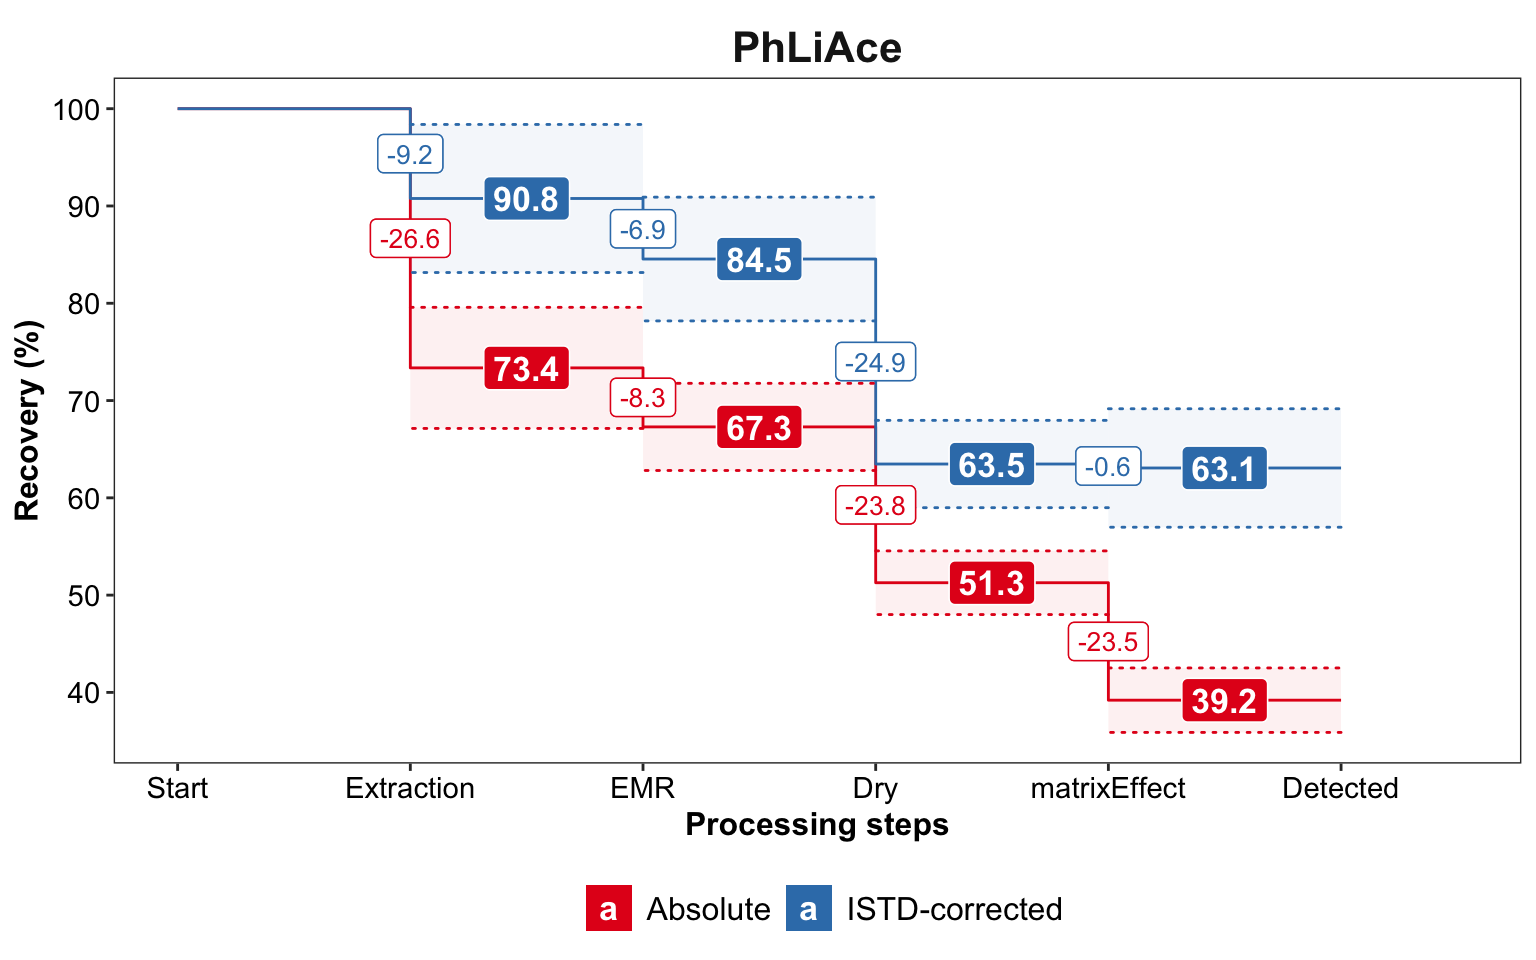
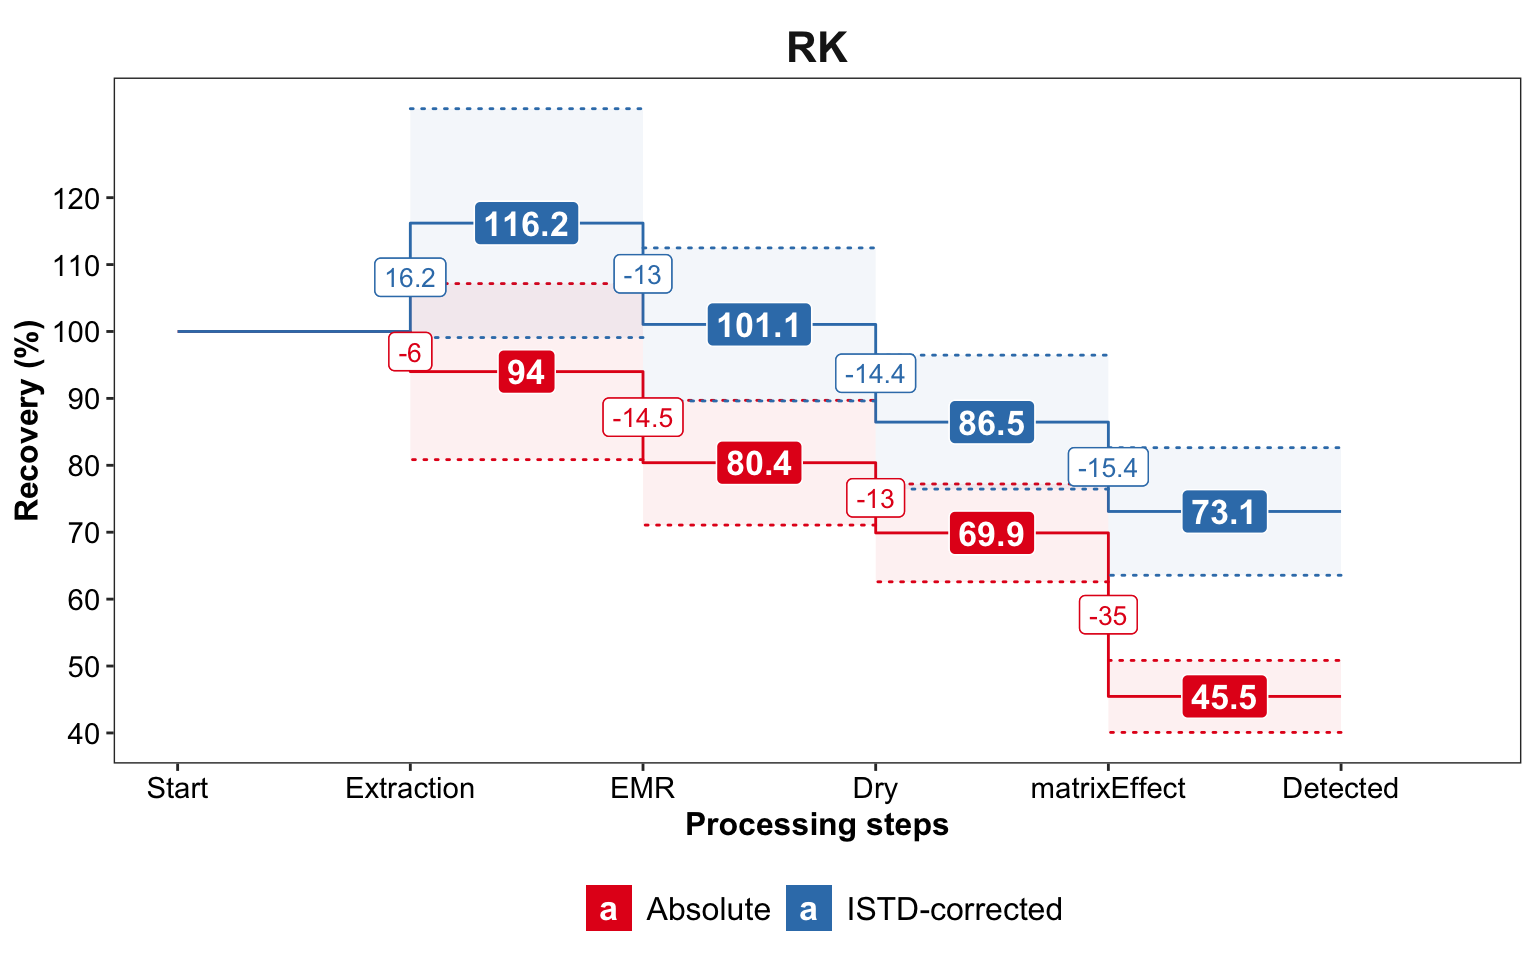
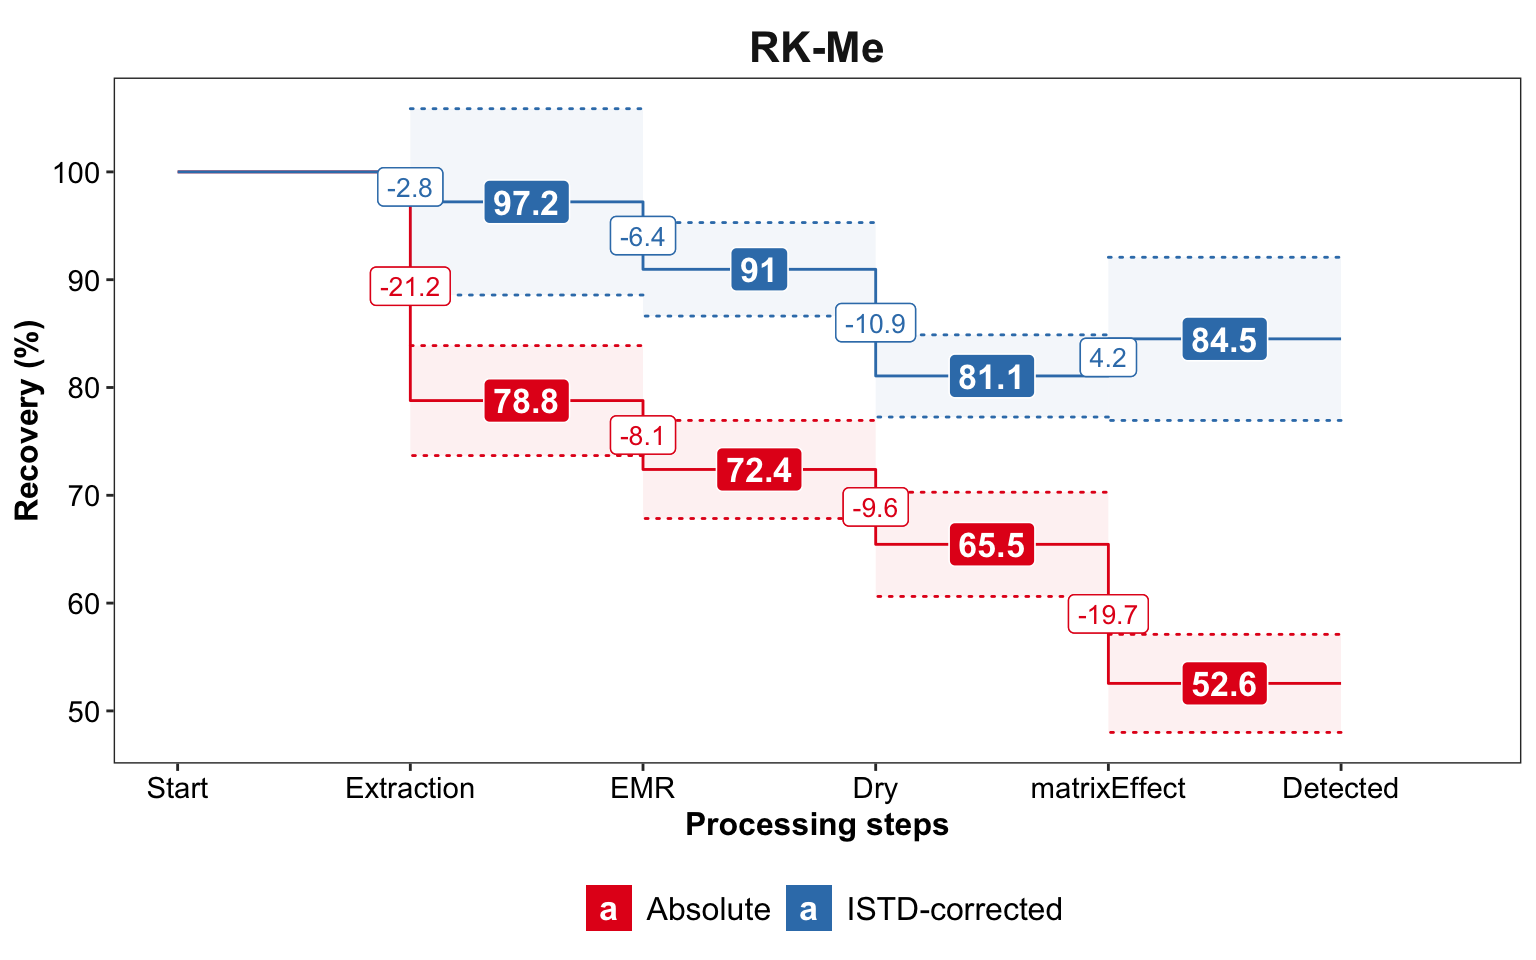
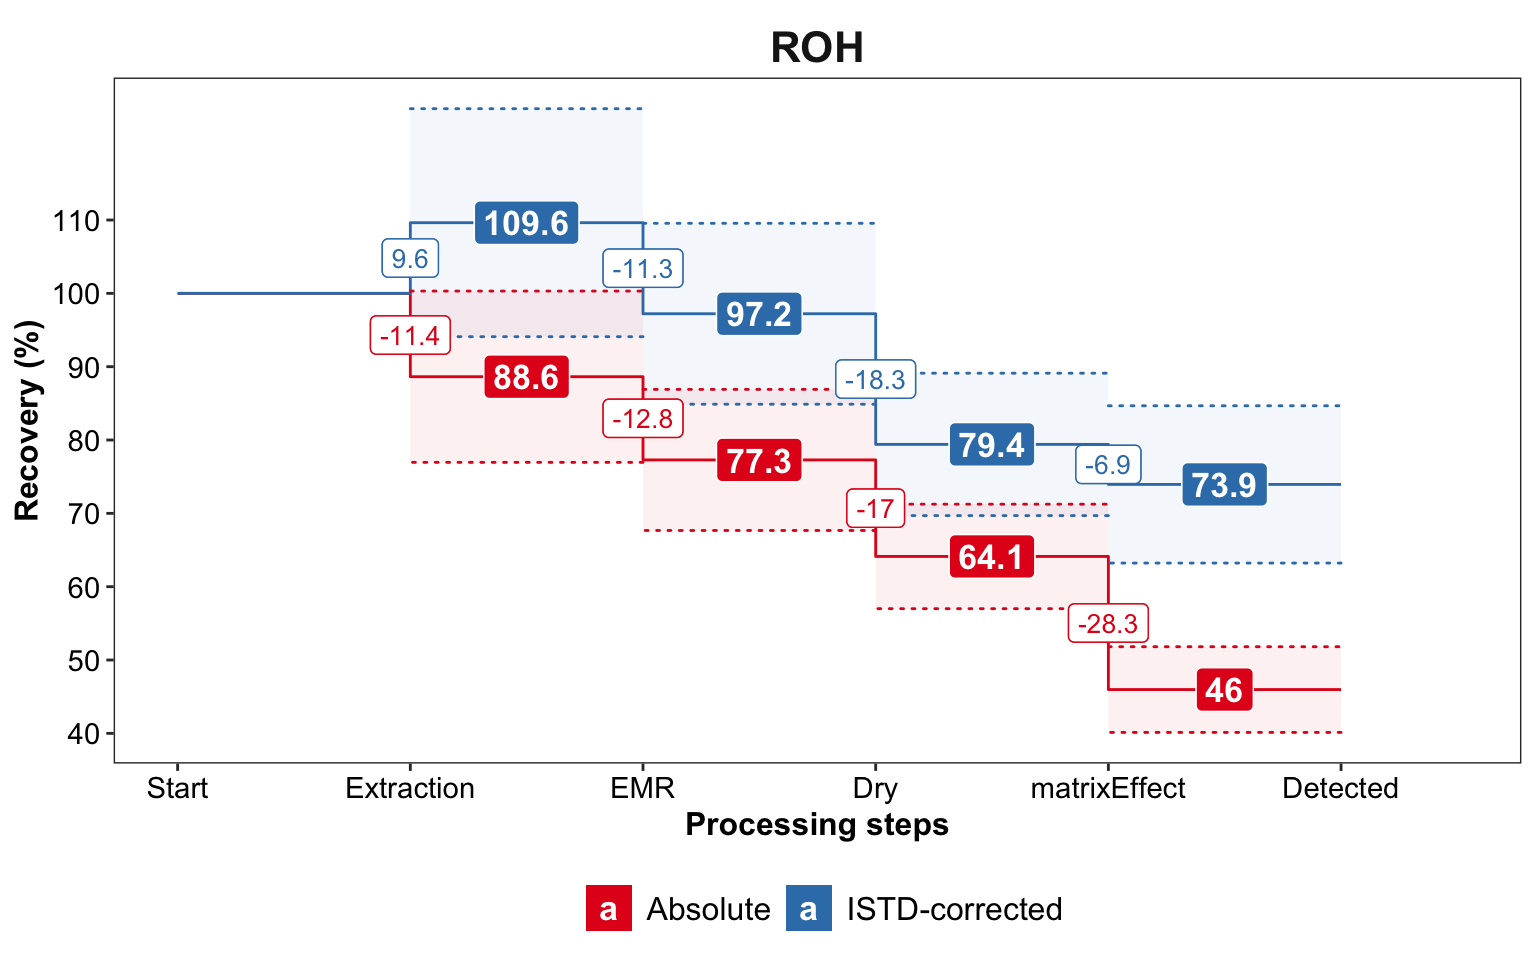
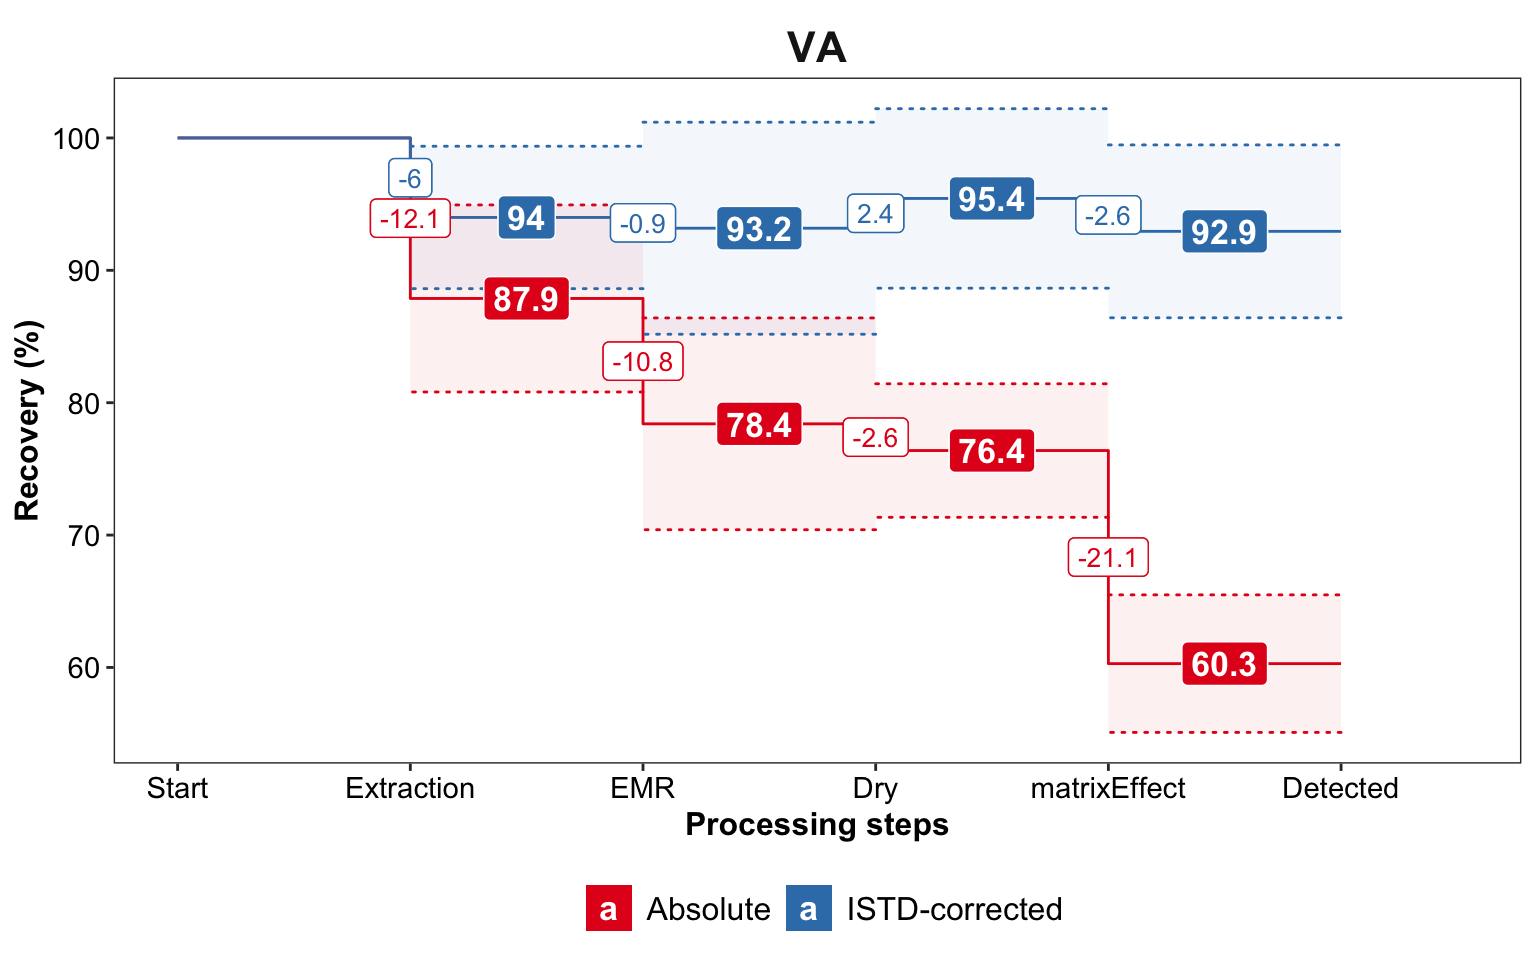
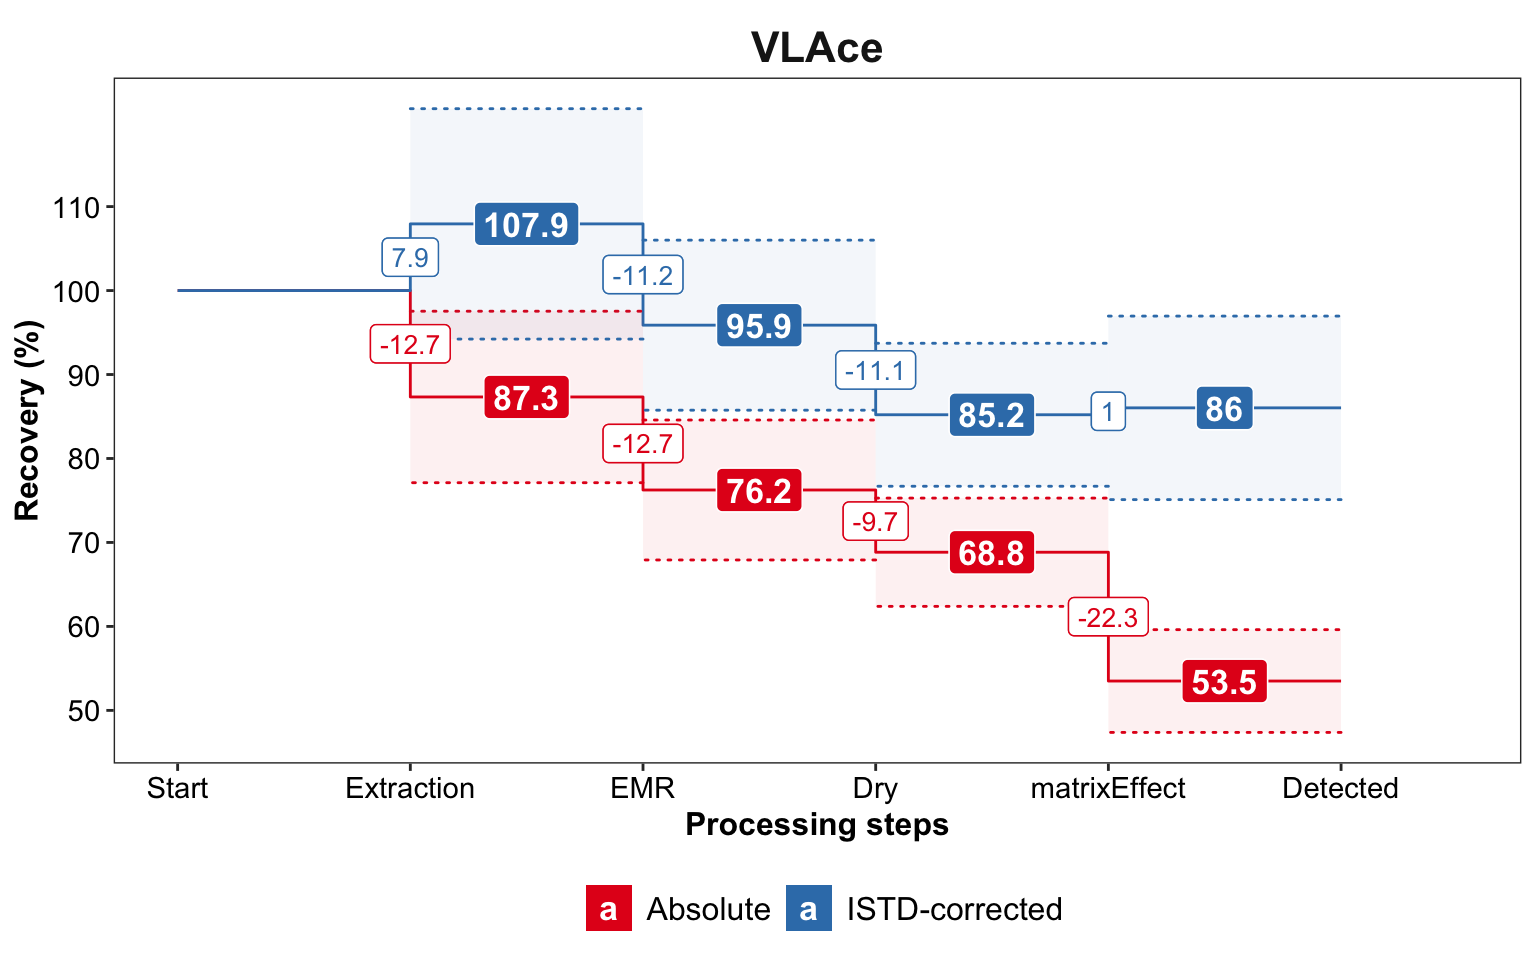
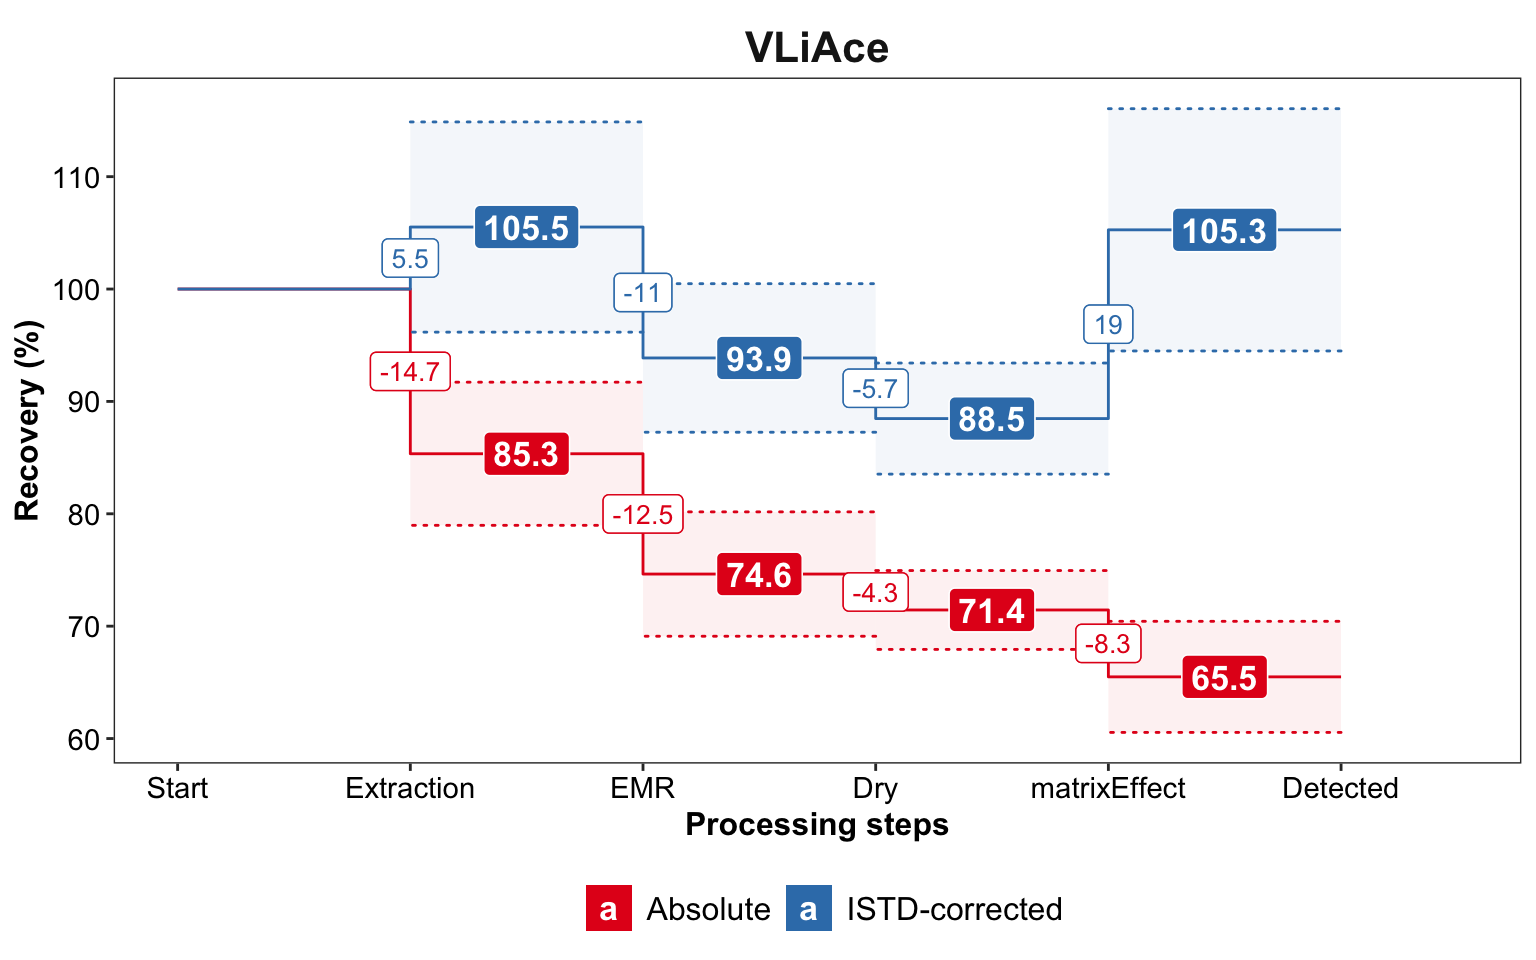
The following figures present the stepwise recovery or signal loss (or possible increase when corrected with internal standard) at each processing step, in terms of changes in either the absolute peak area or the peak area corrected by the internal standard.